
The Observability Stack, Honestly
TL;DR
Cluster observability is a five-job problem — metrics, logs, traces, dashboards, alerts — and the six contenders in 2026 (Grafana+Prometheus+Loki, VictoriaMetrics, Mimir, Tempo/Jaeger, Datadog/New Relic, OpenSearch/Elastic) each treat one or two jobs as primary and the rest as supported-eventually.
Frank runs Grafana with VictoriaMetrics as a Prometheus-compatible
Time Series DatabaseA database built for timestamped numeric series. VictoriaMetrics is Frank's; the shape of the data is why it compresses so much better than a general-purpose store. and Loki for logs, alerts file-provisioned from ConfigMaps to
Telegram. The scars came in the seams: file-provisioned alerts
read-only in the UI, a Grafana 12.x Server-Side ExpressionsGrafana's alerting stage that transforms a query result before the alert condition is evaluated. Grafana 12 requires the three-step query → reduce → threshold form; the older classic-condition shape fails with `sse.parseError`. Not Server-Sent Events, despite the initials. engine that broke half
Frank’s alert rules on a minor-version bump, and an ALERTS{}
series that does not exist in VictoriaMetrics.
Frank’s answer does not generalize. Laptop scale → Grafana Cloud free. Small Open Source SoftwareSoftware whose source is public and freely modifiable. Worth flagging here because several projects ship an OSS build alongside a paid one, and the difference is often exactly the feature you wanted — LiteLLM's Prometheus metrics are Enterprise-only. cluster → Frank’s stack. Production multi-tenant SaaS → Mimir+Tempo+Loki or Datadog/New Relic. Logs-first regulated industry → OpenSearch + Filebeat.
§1 — The capability
It is 3 AM. A workload is misbehaving. The on-call human — or, more charitably, the on-call agent — opens one tab. One screen. They need to know two things, and they need to know them in five seconds: what is broken, and why. If the screen cannot answer those two questions, every other capability of the cluster is moot, because the cluster is, by definition, broken in a way nobody can see.
That is the capability under examination. Not “monitoring” in the abstract — every Kubernetes distribution ships with some dashboard. The capability is the thing that answers the 3 AM question: who keeps the metrics, who keeps the logs, who fires the page, who renders the dashboard the on-call human reads to decide whether to roll back, scale up, or go back to sleep.
    flowchart LR
    W["Workloads"] --> A["Agents / scrapers"]
    A --> O["Observability stack"]
    O --> M["Metrics (TSDB)"]
    O --> L["Logs"]
    O --> T["Traces"]
    O --> D["Dashboards"]
    O --> AL["Alerts → pager"]
The diagram is honest about what “observability” actually contains. It is not one job; it is at least five — metrics, logs, traces, dashboards, and alerts that reach a human. Every vendor in this space treats one or two of those five as the primary problem and ships the rest as adequate-or-better. The vendor space splits on which job is primary, and on whether the answer is assembled from parts or bought as one thing.
Your monitoring system should address two questions: what’s broken, and why? The “what’s broken” indicates the symptom; the “why” indicates a (possibly intermediate) cause.Google SRE Book, Chapter 6
Frank runs Grafana, with Prometheus-compatible VictoriaMetrics for metrics and Loki for logs. No Tempo yet — tracing is not load- bearing for the workloads Frank runs. Alerts are file-provisioned via ConfigMaps and arrive in a Telegram chat. That choice was made on the merits of which scars Frank wanted to live with, not on the merits in the abstract. The point of this paper is to make the trade legible — capability by capability — and then return to Frank’s choice and the operational scars that proved it was correct only on Frank’s terms.
§2 — The landscape
Six options dominate cluster observability in 2026, and they split cleanly on two axes. The horizontal axis is licensing — open source on the left, commercial-with-contract on the right. The vertical axis is the shape of the stack: assembled (you wire metrics + logs + traces + alerts together yourself, often from different OSS projects) versus unified (one product covers the whole telemetry surface and bills as one thing).
quadrantChart

        title Observability stacks — 2026
        x-axis OSS --> Commercial
        y-axis Assembled --> Unified
        quadrant-1 "Unified · Commercial"
        quadrant-2 "Unified · OSS"
        quadrant-3 "Assembled · OSS"
        quadrant-4 "Assembled · Commercial"
        "Grafana+Prom+Loki": [0.20, 0.30]
        "VictoriaMetrics": [0.15, 0.25]
        "Grafana Mimir": [0.20, 0.40]
        "Tempo / Jaeger": [0.15, 0.15]
        "Datadog / New Relic": [0.85, 0.85]
        "OpenSearch / Elastic": [0.35, 0.70]
| Feature | Grafana + Prometheus + Loki | VictoriaMetrics | Grafana Mimir | Tempo / Jaeger | Datadog / New Relic | OpenSearch / Elastic |
|---|---|---|---|---|---|---|
| Metrics | ✅ | ✅ | ✅ | ❌ | ✅ | 🟡 |
| Logs | ✅ | 🟡 | ❌ | ❌ | ✅ | ✅ |
| Traces | 🟡 | ❌ | ❌ | ✅ | ✅ | 🟡 |
| Alerting | ✅ | ✅ | ✅ | ❌ | ✅ | ✅ |
| Dashboards | ✅ | ❌ | ❌ | ❌ | ✅ | ✅ |
| HA / sharding | 🟡 | ✅ | ✅ | 🟡 | ✅ | ✅ |
| OSS / no contract required | ✅ | ✅ | ✅ | ✅ | ❌ | ✅ |
| Cheap at homelab scale | ✅ | ✅ | ❌ | 🟡 | ❌ | ❌ |
The matrix grades the options on the five jobs from §1 plus the license axis, High AvailabilityRunning enough redundant instances that losing one does not take the service down. Frank's three control-plane nodes are its HA tier.-shape, and small-cluster Total Cost of OwnershipEverything a thing costs over its life — hardware, power, and the hours spent operating it. The last term is the one that decides self-host versus rent.. The TCO column deserves more honesty than the matrix gives it — cheap at homelab scale really means cheap on a single 3-node footprint with no in-cluster log retention beyond a week, which is the only TCO axis this paper can defend with citations.
Grafana + Prometheus + Loki is the OSS reference assembly. Grafana for the panels, Prometheus for the metrics scrape, Loki for the index-light log store, Alertmanager (or Grafana’s own unified alerting) for the pager handoff. You build it. The reward is total control and zero per-host bill; the price is that nothing in this list assembles itself.
VictoriaMetrics is a drop-in for the Prometheus TSDB tier, with a friendlier resource footprint at small scale. Frank swapped it in specifically because the stock Prometheus retention costs more RAM than is honest on a 3-control-plane footprint.
VictoriaMetrics uses 5x-10x less RAM than Prometheus for the same data.VictoriaMetrics — Benchmarking
Grafana Mimir is the inverse trade. Where VictoriaMetrics is “Prometheus, but smaller”, Mimir is “Prometheus, but bigger” — a horizontally sharded, object-store-backed, multi-tenant TSDB built for SaaS-scale ingestion. The five-node minimum is unspoken but real.
Tempo / Jaeger is the tracing side of the stack. Tempo is Grafana’s object-store-backed trace backend; Jaeger is the Cloud Native Computing FoundationThe foundation that hosts Kubernetes and most of the projects around it. "CNCF project" is a statement about governance, not quality or maturity. predecessor with its own UI and its own data model. Neither matters to Frank yet — tracing earns its keep when you have services calling services in chains, which Frank does not.
Datadog / New Relic are the unified-commercial answer. One agent per host, one bill, one contract, one dashboard product, one support number. The other five options on this list ask you to operate them; Datadog asks you to pay them. The four golden signals are pre-wired and the alert engine has eight years of polish behind it.
OpenSearch / Elastic is the logs-first answer. Full-text index at write time means full-content queries are fast; the trade is that storage and write CPU costs scale with log volume. The matrix shows them as “partial” on metrics and traces because both projects do support them, but the centre of gravity of each remains the log store.
§3 — How each option handles the hard part
The hard part of observability is turning the cluster’s chaos into one screen a human can read at 3 AM, without burying the real incident under noise. Every vendor on this list has an answer; the answers diverge enough that they need separate diagrams. The diagrams below use a shared visual language — squares for control- plane components, cylinders for data on disk (TSDB / log store / trace store), hexagons for clients (agents, scrapers), solid edges for ingest and query paths, dashed edges for alerting and async handoffs.
Grafana + Prometheus + Loki (Frank’s stack)
    flowchart TD
    subgraph LGTM["Grafana + Prometheus-compat VM + Loki"]
        G["grafana"]
        VM[("VictoriaMetrics TSDB")]
        LO[("Loki log store")]
        AM["alertmanager"]
    end
    S{{"ServiceMonitor / scrape"}}
    A{{"Promtail / Fluentd"}}
    S --> VM
    A --> LO
    G --> VM
    G --> LO
    G -.-> AM
    AM -.-> X["Telegram / Slack"]
Frank’s actual shape. Prometheus’s wire protocol on the ingest
side (which means everything that exports /metrics Just Works);
VictoriaMetrics’ single-binary architecture on the storage side
(which means the resource footprint is honest at three nodes); Loki
on the log side; Grafana’s own unified alerting engine routing
through a Telegram webhook. When a node dies, Grafana keeps
rendering against the surviving VM replica and the alertmanager
keeps firing pages; the failure mode is the dashboard stops
updating, which is, mercifully, very visible.
The unique scar of this stack lives in the alert provenance
boundary. Grafana’s alerting engine distinguishes “alerts created
via the API” (which the UI can edit) from “alerts created via file
provisioning” (which it cannot). Frank’s alerts are all
file-provisioned — sourced from ConfigMaps in
apps/grafana-alerting/manifests/ — and the UI dutifully shows them
as read-only. The kept-honest version is that the editor lets you
click Save and silently throws away the edit on the next pod
restart. That is the scar.
Grafana Mimir
    flowchart TD
    subgraph MIM["Grafana Mimir (HA Prometheus)"]
        DI["distributor"]
        IN1[("ingester · zone-1")]
        IN2[("ingester · zone-2")]
        IN3[("ingester · zone-3")]
        Q["querier"]
        SO[("S3 / object store")]
    end
    S{{"vmagent / scrape"}}
    G["grafana"]
    S --> DI
    DI --> IN1
    DI -.-> IN2
    DI -.-> IN3
    IN1 --> SO
    G --> Q
    Q --> IN1
    Q --> SO
Mimir is what Prometheus looks like when somebody decides that the single-binary model has to go. The distributor sharded across ingesters via consistent hashing; the ingesters write to S3 (or S3-compatible object storage) on a rolling window; the querier reads from both the live ingesters and the object store transparently. The cost is the architectural minimum of “distinct distributors + ingesters + queriers + object store” — there is no honest one-node Mimir. The reward is real horizontal scale and real multi-tenancy. Recovery from a node loss is automatic; recovery from an object store loss is “rebuild from cold storage, hope you had backups.”
Tempo / Jaeger
    flowchart TD
    subgraph TR["Tempo / Jaeger (tracing)"]
        D["distributor / collector"]
        IN[("ingester")]
        Q["query frontend"]
        SO[("S3 / object store")]
    end
    A{{"OTLP / Jaeger client"}}
    G["grafana / jaeger UI"]
    A --> D
    D --> IN
    IN --> SO
    G --> Q
    Q --> SO
Tracing is structurally different from metrics and logs because the unit of data is not a sample; it is a span, and spans aggregate into traces that span service boundaries. The pipeline is collector → ingester → object store, and queries reconstruct the trace from spans scattered across the store. The hard part is not storage; it is sampling — head-based, tail-based, or none — because the volume of traces at any meaningful production scale is too high to keep all of them, and the choice of sampling strategy directly determines what kinds of incidents the trace store can answer questions about.
Datadog / New Relic (commercial all-in-one)
    flowchart TD
    subgraph DC["Datadog (or New Relic) SaaS"]
        SaaS["proprietary backend"]
    end
    A{{"datadog-agent / nr-agent (in cluster)"}}
    G["proprietary UI"]
    A --> SaaS
    G --> SaaS
    SaaS -.-> PG["PagerDuty / proprietary pager"]
Architecturally unremarkable on purpose — the value of the commercial all-in-one is not its data plane shape; it is the one product covers everything surface. One agent on every host shipping metrics, logs, traces, and host telemetry into one SaaS backend. The UI is one product. The bill is one bill. The support line is one phone number. When the backend is broken, somebody else’s on-call rotation handles it. The diagram is mostly unremarkable because the point of Datadog is not its architecture; it is its contract.
OpenSearch / Elastic (logs-first)
    flowchart TD
    subgraph OS["OpenSearch / Elastic"]
        M["cluster master"]
        D1[("data node · 1")]
        D2[("data node · 2")]
        D3[("data node · 3")]
        K["dashboards (OpenSearch Dashboards / Kibana)"]
    end
    A{{"Filebeat / Fluentd"}}
    A --> M
    M --> D1
    M --> D2
    M --> D3
    K --> M
OpenSearch and Elastic are the inverted-index answer to logs. Every log line is tokenised and indexed at write time — which means full-text queries against years of logs run in milliseconds, and which means storage and write-CPU cost are very real at scale. The shape is a sharded inverted-index data plane fronted by Kibana or OpenSearch Dashboards. Tracing and metrics are bolted on but are not the centre of gravity; the centre of gravity is the log store. The cost story flips here:
Loki indexes only metadata (labels) for log entries, while Elasticsearch indexes the full content of logs. This fundamental design choice has significant implications for storage costs, query performance, and use cases.SigNoz — Loki vs Elasticsearch
§4 — What scale changes
Three scale axes flip vendor rankings. The first two are quantitative; the third is philosophical.
Metric cardinality. Prometheus’s in-process TSDB is
cardinality-bound — millions of active time series degrade ingest
latency and inflate memory in ways that are not graceful. Two
escape hatches dominate the space: VictoriaMetrics, which keeps
the single-binary shape and engineers its storage layout to absorb
high cardinality with a smaller footprint; and Grafana Mimir,
which abandons the single-binary shape entirely and shards
ingesters horizontally. VictoriaMetrics’ own benchmark — biased
but reproducible — claims a 5–10× RAM reduction over Prometheus
for the same data, and a 1.6–3.2× reduction in scrape-agent
resource cost via vmagent over Prometheus’ agent mode and the
OpenTelemetry Collector.
Log volume versus query cost. Loki and Elasticsearch sit at opposite ends of the index-at-write versus index-at-query trade. Loki only indexes labels — log content is scanned at query time out of object storage. Elasticsearch indexes every token at write time, which makes queries fast and storage expensive. The practitioner consensus is that Loki wins decisively on storage cost at retention horizons longer than a month, and Elasticsearch wins decisively on full-text query latency for selective historical searches. There is no third answer; the trade is structural.
Tracing sample rate. Tempo and Jaeger cost scale with trace volume, which means the operational choice is not “do we run tracing” but “what sampling strategy”. Head-based sampling decides at trace creation whether to keep a trace, which keeps the ingest path cheap and loses the ability to retroactively keep “interesting” traces. Tail-based sampling keeps all traces in a buffer and decides at the end of the trace, which keeps the diagnostically-interesting traces and shifts the cost into the buffer. No sampling — keep everything — is honest at low volume and disastrous at high volume. Most teams discover their sampling strategy after their second incident with no useful trace data, not before.
Cardinality, log volume, and trace volume scale-out independently — which is why the unified-SaaS stacks bill per-each. When all three grow simultaneously, the commercial bill grows multiplicatively; when the OSS assembly is in the way, the cost is operator hours, which scale slower but eventually win in the other direction.
§5 — Frank’s choice, and what happened
Frank runs Grafana with VictoriaMetrics as the Prometheus-compatible
TSDB and Loki as the log store. No Tempo yet — tracing is not
load-bearing for the workloads Frank runs. Alerts are file-
provisioned via ConfigMaps in apps/grafana-alerting/manifests/.
The contact point is a Telegram chat, with the bot token and chat
ID in Infisical. Honest about what was assumed (Grafana file-
provisioning would behave like a Kubernetes ConfigMap — hot-watched,
edits eventually consistent with what’s on disk) and what turned
out to be true (it isn’t).
The honesty of that choice is what makes the resulting scars worth writing down. A managed SaaS would have hidden every one of them.
The three scars share a shape. None of them are bugs in Grafana or in VictoriaMetrics; all of them are emergent properties of an assembled observability stack where the pieces have slightly different mental models of what “the same alert” means. The seams are where the failures live — exactly where the marketing material does not look.
Visible evidence:
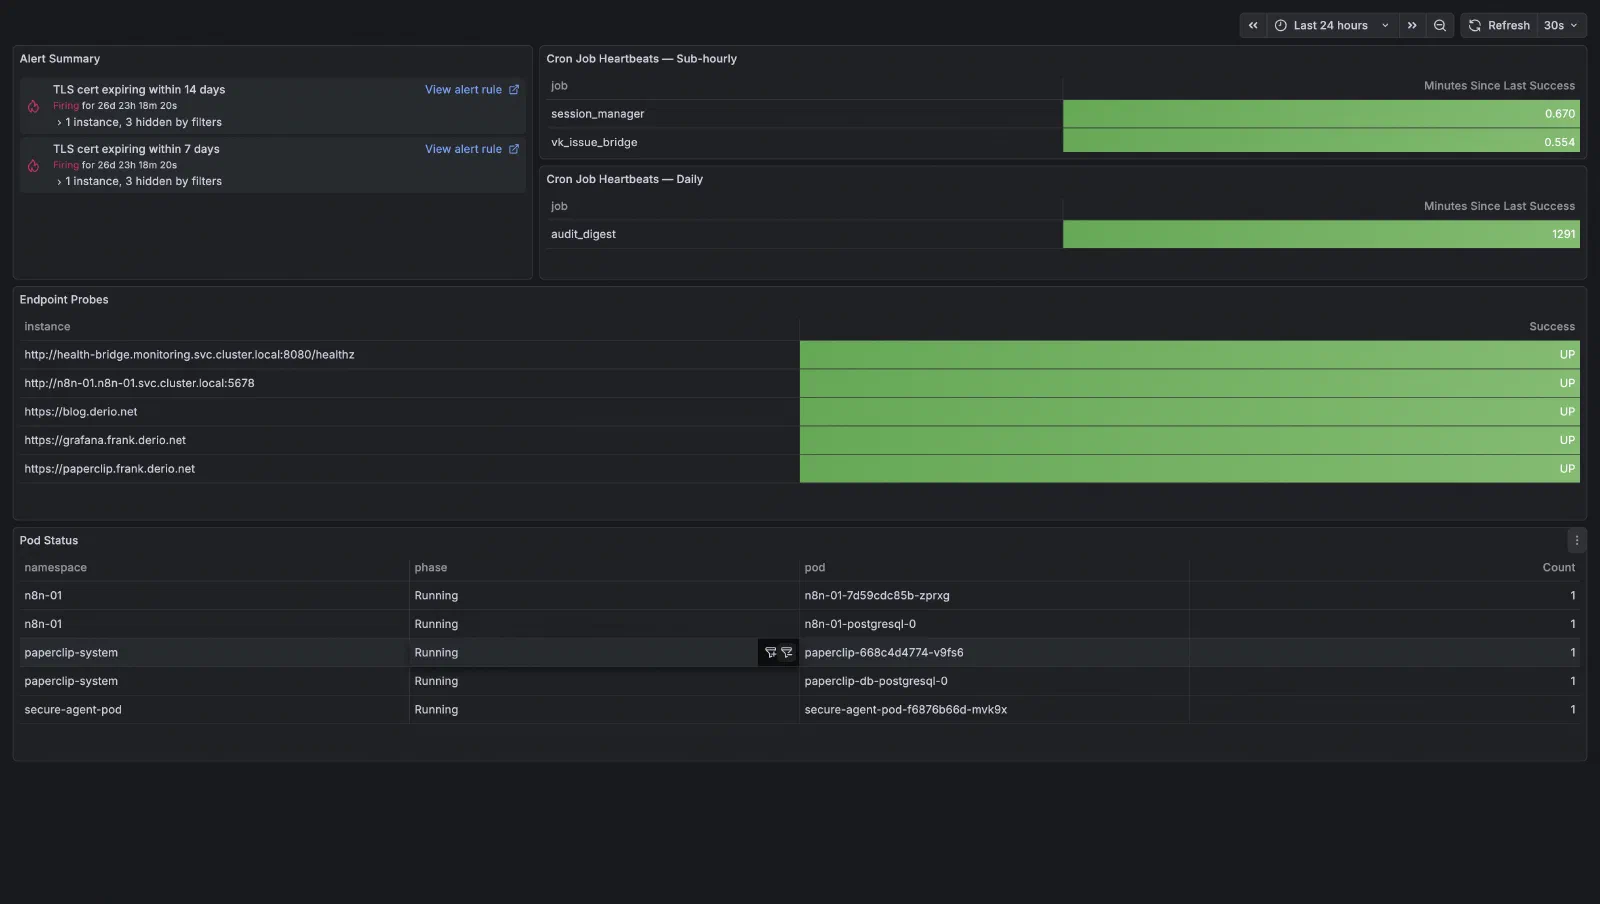
A managed all-in-one would have hidden every one of these failure modes behind its abstraction, which is the right trade for a production team and the wrong trade for a learning platform. Frank exists to encounter the SSE-parse-error on the upgrade so that the next operator on this stack does not have to.
§6 — When Frank’s answer doesn’t generalize
Frank’s answer — Grafana + Prometheus-compatible VictoriaMetrics + Loki, file-provisioned alerts to Telegram — is one leaf of a four- leaf tree. The other three are real.
    flowchart TD
    A["What's your scale?"] -- "Single VM / laptop" --> L1["Docker stats + Grafana Cloud free"]
    A -- "1–3 small clusters, OSS-only" --> L2["Grafana + Prom + Loki (Frank's pick)"]
    A -- "Multi-tenant SaaS, business-critical" --> L3["Mimir + Tempo + Loki  OR  Datadog / New Relic"]
    A -- "Logs-first regulated industry" --> L4["OpenSearch + Filebeat"]
The first branch is scale and shape. A single VM has no
observability stack problem — docker stats plus a free Grafana
Cloud tier covers the entire need, and the operator’s time is the
expensive resource. One-to-three small clusters with no
compliance constraint is where Frank lives: the OSS assembly is
cheap to run and the scars are tolerable.
A multi-tenant SaaS with revenue-grade Service Level AgreementThe contractual promise about a service, with consequences attached. The commercial wrapper around an SLO. pushes the answer in two directions at once. Either you scale the OSS assembly to Mimir-shaped horizontal sharding (with all the operational tax of running a horizontally sharded TSDB), or you pay Datadog / New Relic and let somebody else’s on-call rotation handle the data plane. Both are correct answers; the choice is whether your team has more spare engineering capacity than spare cash.
A logs-first regulated industry — finance, healthcare, anything where audit retention is a legal requirement — pushes OpenSearch or Elastic to the front of the line. The index-at-write design that costs Loki on volume wins when the question is “find the log line where customer X did Y in 2023,” because Loki’s index-at- query model cannot answer that question in less than minutes at years-scale.
This is the section where the paper has to be honest about its audience. If you are reading this from a production engineering team with real on-call hours and real revenue depending on uptime, the right answer for you is almost never Frank’s answer. The right answer is one of the other three leaves. Frank’s answer is correct for Frank and is documented here so that anyone considering the trade understands the rest of the leaves before picking the same one.
§7 — Roadmap & where this space is going
Three trends are worth naming. None of them are settled; all of them affect the next few years of observability tooling.
OpenTelemetry collector as the universal agent. OTel is eating the agent layer. Prometheus’s own client libraries increasingly defer to it; Grafana’s recent agent shipments converge on it; vendors of every shape now accept OpenTelemetry ProtocolThe vendor-neutral wire format for traces, metrics and logs — the thing that makes swapping an observability backend a configuration change rather than a re-instrumentation. as a wire protocol. The two-decade-old “every vendor has its own agent” anti-pattern is finally dying, which means the choice of agent and the choice of backend are decoupling for the first time. The interesting question is not whether OTLP wins — it is winning — but what happens to vendor lock-in when the wire is standardised and the backend is the only thing left to switch.
eBPF-native observability. Cilium Hubble, Pixie, Parca, Pyroscope, and a growing set of profiling tools collect telemetry by reading kernel events directly, eliminating the in-pod agent for a non-trivial subset of signals. Frank already runs Hubble for network observability; profiling-as-a-cluster-capability is the next direction the space moves. The cost of the eBPF approach is that the signal lives below the userspace boundary, which makes it hard to retrofit into applications that expect to instrument themselves explicitly.
AI-assisted alert triage. Every commercial vendor is shipping “AI alert grouping” or “anomaly detection” of varying quality. The OSS side has not caught up. Whether the gap closes — and whether the closing is real signal or wrapper-around-an-Large Language ModelA model trained to predict text, served behind a chat or completion endpoint. On Frank these run locally on the GPU node rather than against a hosted provider. theatre — is the most consequential open question in this space for the next 2–3 years. Frank does not have an opinion yet because Frank has not seen a real one work.
The space is not done evolving. Frank will revisit this paper when the answers change.
References
- vendor-docs
Prometheus Operator — Getting Started
The Prometheus Operator provides Kubernetes native deployment and management of Prometheus and related monitoring components.
ServiceMonitor, which declaratively specifies how groups of Kubernetes services should be monitored. The Operator automatically generates Prometheus scrape configuration based on the current configuration of the API objects.
Anchors the §3 architecture diagram for the LGTM stack — defines the ServiceMonitor model Frank actually uses for in-cluster discovery and the operator-managed reconciliation loop that produces the live Prometheus scrape config.
- vendor-docs
VictoriaMetrics — Overview & Architecture
VictoriaMetrics is a fast, cost-effective and scalable monitoring solution and time series database.
It is optimized for storage with high-latency IO and low IOPS (HDD and network storage in AWS, GCP, Azure, etc.) compared to other solutions.
Vendor's own articulation of the small-cluster wins — low IOPS, low RAM, Prometheus wire-compatible. Anchors the §2 vendor positioning and the §4 'metric cardinality' callout that drives Frank's choice of VM over a stock Prometheus TSDB.
- paper
Google SRE Book — Monitoring Distributed Systems (Chapter 6)
Monitoring a very complex application is a significant engineering endeavor in and of itself. Even with substantial existing infrastructure for instrumentation, collection, display, and alerting in place, a Google SRE team with 10–12 members typically has one or sometimes two members whose primary assignment is to build and maintain monitoring systems for their service.
Your monitoring system should address two questions: what's broken, and why? The 'what's broken' indicates the symptom; the 'why' indicates a (possibly intermediate) cause.
The foundational text on what an observability system is FOR — symptom vs cause, the four golden signals, the cost of monitoring as engineering effort. Cited in §1 to frame the capability and in §5 to ground Frank's choice to provision alerts from code, not click-ops.
- vendor-docs
Grafana Alerting — Documentation
Grafana Alerting is a unified alerting system, where alerts are managed in a single location for all your data sources.
Alert rules: Define the conditions that trigger alerts. Each rule consists of one or more queries and expressions, a condition that needs to be met, and an interval at which the rule should be evaluated.
Underwrites §3 (alerting architecture diagram) and §5 (the 12.x SSE alert rules need a 3-step A→B→C — the classic-condition format that worked in Grafana 11 breaks with sse.parseError on 12.x). Vendor's authoritative description of the alert-rule shape Frank's alerts must conform to.
- postmortem
SigNoz — Loki vs Elasticsearch (practitioner comparison)
Loki indexes only metadata (labels) for log entries, while Elasticsearch indexes the full content of logs. This fundamental design choice has significant implications for storage costs, query performance, and use cases.
Loki is significantly more cost-effective for storing large volumes of logs because of its index-light design and use of object storage backends like S3, GCS, or local filesystems.
Practitioner-level head-to-head with concrete trade-offs on the index-at-write vs index-at-query split. Used in §3 to explain why Loki's log model is structurally different from OpenSearch/Elastic, and in §4 to ground the log-volume-vs-query-cost callout.
- benchmark
VictoriaMetrics — Benchmarking Prometheus-compatible time series databases
vmagent uses 3.2x/1.6x less CPU and 2.7x/3.0x less memory than competing scrape agents (OpenTelemetry Collector and Prometheus 3.x).
VictoriaMetrics uses 5x-10x less RAM than Prometheus for the same data.
Vendor-published benchmark — biased but reproducible. Anchors the §4 cardinality / resource-cost callout that justifies Frank's swap from stock Prometheus to VictoriaMetrics on a small-cluster footprint.
- postmortem
Frank — Grafana gotchas (file-provisioned alerts, SSE alert format, ALERTS{} in VM)
File-provisioned alerts/dashboards in apps/grafana-alerting/manifests/ are read-only in UI; edit ConfigMap, push, restart pod (provisioning files are read at boot, not watched).
12.x SSE alert rules need 3-step A→B→C; classic-condition format fails with sse.parseError.
ALERTS{} does NOT exist in VM for Grafana-managed alerts — use alertlist panel type.
Frank's own running postmortem registry — concrete operational scars accumulated while running the Grafana stack against VictoriaMetrics. Provides the source-of-truth one-liners and recovery commands for §5 scar callouts.