

Observability — Metrics and Logs with VictoriaMetrics
A cluster without observability is a box of mystery. Pods crash silently. Memory leaks hide behind restart counts. Network blips become finger-pointing exercises. Layer 7 fixes that: a full metrics and logging stack built around VictoriaMetrics, VictoriaLogs, and Grafana, managed by ArgoCD, backed by Longhorn storage.
But three things went wrong during the deployment. A stale webhook from a reinstall completely broke resource reconciliation — objects existed but nothing happened to them. A wrong service hostname had Fluent Bit retrying silently, producing zero log data with no errors. And a Helm chart composition issue made additionalDataSources silently ignored. Each of these cost about an hour to diagnose. Documenting them here so you do not lose that hour.
    flowchart LR
  subgraph Sources[Data Sources]
    KSM[kube-state-metrics<br/>K8s object metrics]
    NE[node-exporter<br/>node metrics]
    K8s[Kubernetes API<br/>kubelet metrics]
    FB[Fluent Bit<br/>container logs]
  end
  subgraph VM[VictoriaMetrics Stack]
    VMSingle[VMSingle<br/>metrics DB]
    Agent[vmagent<br/>scraper]
    Grafana[Grafana<br/>192.168.55.203]
  end
  subgraph VL[VictoriaLogs]
    VLSingle[VictoriaLogs<br/>logs DB]
  end

  KSM --> Agent
  NE --> Agent
  K8s --> Agent
  Agent --> VMSingle
  VMSingle --> Grafana
  FB --> VLSingle
  VLSingle --> Grafana
Why VictoriaMetrics Instead of Prometheus
The standard choice is kube-prometheus-stack — Prometheus, Alertmanager, Grafana, and a bundle of exporters. It works well, but it is heavy. On a homelab where control-plane nodes also run workloads, baseline resource consumption matters.
| Component | kube-prometheus-stack | victoria-metrics-k8s-stack |
|---|---|---|
| Prometheus / VMSingle | ~1–2 GB RAM | ~50–150 MB RAM |
| Full stack baseline | ~2–4 GB RAM | ~200–400 MB RAM |
| Storage format | Time Series DatabaseA database built for timestamped numeric series. VictoriaMetrics is Frank's; the shape of the data is why it compresses so much better than a general-purpose store. (per-sample blocks) | custom compressed format |
| Long-term retention | needs Thanos / Cortex | built-in, single binary |
VictoriaMetrics is not a drop-in replacement in the sense that it requires rethinking the architecture — but the victoria-metrics-k8s-stack Helm chart is deliberately structured to be familiar to anyone who has used kube-prometheus-stack. It ships the same CustomResourceDefinitionThe object that teaches the Kubernetes API a new resource type. Install a CRD and the API server starts serving a kind it has never heard of, with validation and RBAC like any built-in. patterns (VMServiceMonitor, VMPodMonitor), the same Grafana dashboards, and the same exporters.
The Stack
Four ArgoCD Applications make up the observability layer:
victoria-metrics — Core chart (victoria-metrics-k8s-stack v0.72.4). Deploys:
VMSingle— single-node time-series DB with 20Gi Longhorn PersistentVolumeClaimA Kubernetes request for durable storage. The pod names a claim and the storage layer — Longhorn on Frank — binds real disk behind it, so the data outlives the pod., 1-month retentionvmagent— metrics scraper; readsVMServiceMonitorandVMPodMonitorCRDsnode-exporter— DaemonSet on all nodeskube-state-metrics— Kubernetes object metrics- Grafana — with 1Gi Longhorn PVC, exposed at
192.168.55.203
victoria-logs — Separate chart (victoria-logs-single v0.11.28). Single-node log storage with 20Gi Longhorn PVC, 14-day retention.
fluent-bit — DaemonSet on all nodes. Ships container logs to VictoriaLogs via HTTP jsonline.
Note: vmalert and alertmanager are disabled in this layer. Alerting is planned for later after rules are properly tuned.
Deployment Details
All three Applications follow the same dual-source pattern: upstream Helm chart + Git repo for values:
# apps/root/templates/victoria-metrics.yaml
apiVersion: argoproj.io/v1alpha1
kind: Application
metadata:
  name: victoria-metrics
  namespace: argocd
  finalizers:
    - resources-finalizer.argocd.argoproj.io
spec:
  project: infrastructure
  sources:
    - repoURL: https://victoriametrics.github.io/helm-charts/
      chart: victoria-metrics-k8s-stack
      targetRevision: "0.72.4"
      helm:
        releaseName: victoria-metrics
        valueFiles:
          - $values/apps/victoria-metrics/values.yaml
    - repoURL: {{ .Values.repoURL }}
      targetRevision: {{ .Values.targetRevision }}
      ref: values
  destination:
    server: {{ .Values.destination.server }}
    namespace: monitoring
  syncPolicy:
    automated:
      prune: false
      selfHeal: true
    syncOptions:
      - ServerSideApply=true
      - RespectIgnoreDifferences=true
  ignoreDifferences:
    - group: ""
      kind: Secret
      jsonPointers:
        - /data
Two sync options matter. ServerSideApply=true avoids the 256KB annotation size limit that client-side apply hits with large Helm charts. RespectIgnoreDifferences=true works with the ignoreDifferences block to stop flagging Grafana’s auto-generated credentials Secret as drifted.
Values:
# apps/victoria-metrics/values.yaml
vmalert:
  enabled: false
alertmanager:
  enabled: false
kubeControllerManager:
  enabled: false   # service name exceeded 63 chars

vmsingle:
  spec:
    retentionPeriod: "1"
    storage:
      storageClassName: longhorn
      accessModes:
        - ReadWriteOnce
      resources:
        requests:
          storage: 20Gi

grafana:
  enabled: true
  service:
    type: LoadBalancer
    loadBalancerIP: 192.168.55.203
  persistence:
    enabled: true
    storageClassName: longhorn
    size: 1Gi
  plugins:
    - victoriametrics-logs-datasource
The kubeControllerManager scrape is disabled for an unglamorous reason: the generated service name (victoria-metrics-victoria-metrics-k8s-stack-kube-controller-manager) is 65 characters. Kubernetes allows 63.
Gotcha 1: The Stale ValidatingWebhookConfiguration
This one cost about an hour.
Symptom
After initial sync, VMSingle came up healthy. But vmagent never appeared — no Deployment, no pods, no events. ArgoCD showed Synced/Degraded with a cryptic error. kubectl get vmagent -n monitoring showed the object existed. kubectl describe showed nothing obviously wrong.
Diagnosis
The victoria-metrics operator uses a ValidatingWebhookConfiguration to validate its custom resources. The sequence:
- First install: operator deployed, registered webhook with its own CA bundle
- Something went wrong mid-install (the 63-char service name issue)
- Application was deleted and reinstalled
- The old
ValidatingWebhookConfigurationremained — not owned by the Helm release - The stale webhook pointed at the old operator’s Transport Layer SecurityThe encryption under HTTPS and most other secure protocols. What a certificate is for, and what fails visibly when the certificate does not match the hostname. certificate
- Every API call to reconcile the
VMAgentresource hit the webhook, TLS handshake failed, reconciliation silently dropped
The giveaway:
Warning  FailedCreate  validatingwebhookconfiguration/victoria-metrics-victoria-metrics-operator-admission
  x509: certificate signed by unknown authority
Fix
Delete the stale webhook. The operator re-registers within seconds:
kubectl delete validatingwebhookconfiguration \
  victoria-metrics-victoria-metrics-operator-admission
The lesson: when an operator uses admission webhooks and the install/reinstall cycle is not clean, check for stale ValidatingWebhookConfiguration objects. They survive Helm releases and cause ghost-in-the-machine behavior where objects exist but nothing happens.
Gotcha 2: The Fluent Bit Hostname
Symptom
Fluent Bit DaemonSet was running on all nodes. No errors in logs. But VictoriaLogs showed zero documents. Fluent Bit showed continuous retry loops: [engine] flush chunk ... retry=true.
Diagnosis
Fluent Bit’s [OUTPUT] block uses an HTTP plugin to forward logs. The Host field must resolve in-cluster. The initial config used:
Host victoria-logs-victoria-logs-single.monitoring.svc.cluster.localThat hostname does not exist. The victoria-logs-single chart names its Service with a -server suffix: the actual name is victoria-logs-victoria-logs-single-server. The chart does not document this clearly.
To find the correct name:
kubectl get svc -n monitoring | grep victoria-logsvictoria-logs-victoria-logs-single-server ClusterIP 10.96.x.x <none> 9428/TCPFix
# apps/fluent-bit/values.yaml
config:
  outputs: |
    [OUTPUT]
        Name            http
        Match           kube.*
        Host            victoria-logs-victoria-logs-single-server.monitoring.svc.cluster.local
        Port            9428
        URI             /insert/jsonline?_stream_fields=stream,kubernetes_pod_name,kubernetes_namespace_name,kubernetes_container_name&_msg_field=log&_time_field=time
        Format          json_lines
        Json_Date_Key   time
        Json_Date_Format iso8601
        Retry_Limit     False
The lesson: DNS failures in Kubernetes are silent killers. Fluent Bit does not differentiate between “server returned error” and “DNS lookup failed” in its retry output. When a log shipper shows retries with no error detail, the first check is whether the destination hostname resolves.
The Fluent Bit DaemonSet tolerates control-plane and GPU node taints to run everywhere:
tolerations:
  - key: node-role.kubernetes.io/control-plane
    operator: Exists
    effect: NoSchedule
  - key: nvidia.com/gpu
    operator: Exists
    effect: NoSchedule
Gotcha 3: additionalDataSources Does Not Work
Symptom
After deploying both VictoriaMetrics and VictoriaLogs, Grafana had VictoriaMetrics pre-configured (handled by the chart), but VictoriaLogs was absent. Adding it via grafana.additionalDataSources in the victoria-metrics values had no effect regardless of how many times the Application was synced.
Diagnosis
The victoria-metrics-k8s-stack chart manages Grafana datasource provisioning through its own ConfigMap — victoria-metrics-victoria-metrics-k8s-stack-grafana-ds — rather than delegating to the Grafana subchart’s provisioning mechanism. grafana.additionalDataSources, which works by adding entries to the Grafana subchart’s own ConfigMap, is never consulted.
Fix
A standalone provisioning ConfigMap mounted into Grafana via extraConfigmapMounts:
# apps/victoria-metrics/manifests/grafana-victorialogs-ds.yaml
apiVersion: v1
kind: ConfigMap
metadata:
  name: grafana-victorialogs-datasource
  namespace: monitoring
data:
  victorialogs-datasource.yaml: |
    apiVersion: 1
    datasources:
      - name: VictoriaLogs
        type: victoriametrics-logs-datasource
        access: proxy
        url: http://victoria-logs-victoria-logs-single-server.monitoring.svc.cluster.local:9428
        isDefault: false
        editable: false
Mounted via:
grafana:
  extraConfigmapMounts:
    - name: victorialogs-datasource
      mountPath: /etc/grafana/provisioning/datasources/victorialogs.yaml
      subPath: victorialogs-datasource.yaml
      configMap: grafana-victorialogs-datasource
      readOnly: true
The lesson: Helm chart composition is leaky. When chart A embeds chart B as a subchart, chart A can intercept anything chart B would have done. The escape hatch is extraConfigmapMounts — it operates at the Pod level and is independent of the chart’s own provisioning logic.
What Is Visible Now
Grafana at http://192.55.203 ships dashboards:
- Node Exporter Full — per-node CPU, memory, disk I/O, network
- Kubernetes / Compute Resources / Cluster — cluster-wide CPU/memory requests vs usage
- Kubernetes / Compute Resources / Namespace — same per namespace
- VMAgent — internal scraping metrics
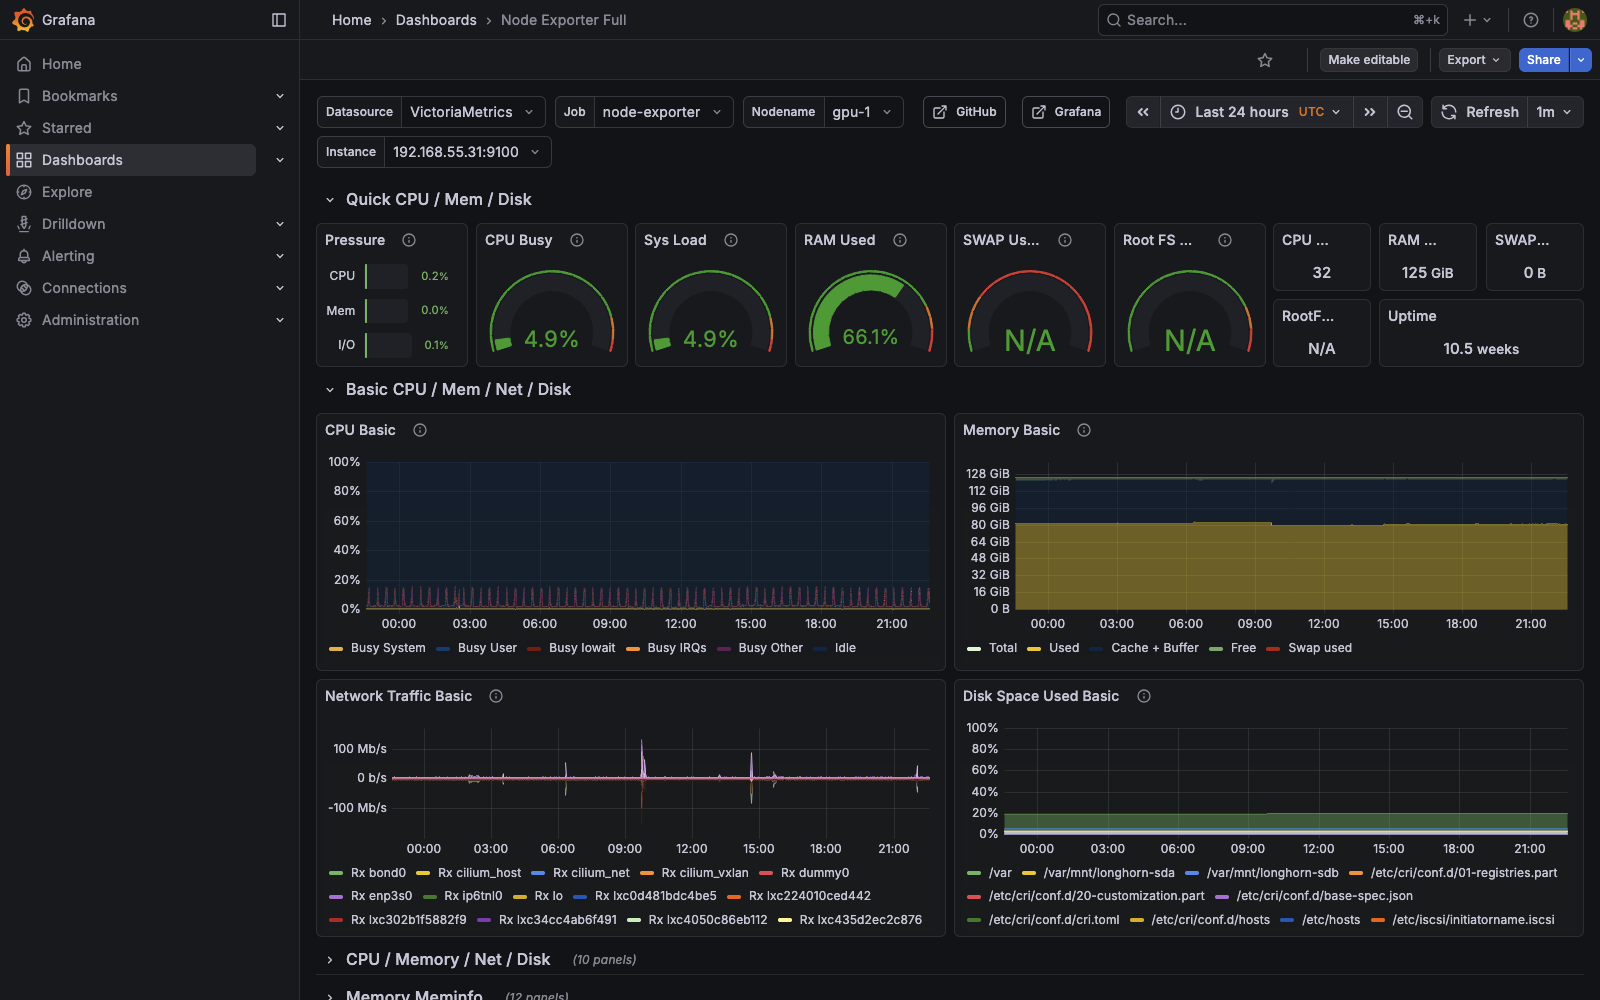
VictoriaLogs is queryable via Grafana Explore:
# All logs from argocd
{kubernetes_namespace_name="argocd"}

# Specific pod
{kubernetes_pod_name=~"victoria-metrics.*"}

# Error lines across cluster
{kubernetes_namespace_name=~".+"} |= "error"
Missteps
| What Happened | Why It Was Wrong | How We Fixed It | Commit |
|---|---|---|---|
| Stale ValidatingWebhookConfiguration from reinstall — deleting and recreating the Application left the old webhook pointing at a nonexistent operator TLS cert | The webhook was not owned by the Helm release; Helm did not clean it up on uninstall | Manual kubectl delete validatingwebhookconfiguration; operator re-registered with fresh cert | edec8a48 |
Fluent Bit hostname missing -server suffix — the VictoriaLogs chart appends -server to its Service name, which is not documented in the chart README | Wrong DNS name caused silent retry loops with no error output; Fluent Bit retries on any transport failure without differentiating DNS from HTTP errors | Corrected Host to victoria-logs-victoria-logs-single-server.monitoring.svc.cluster.local | 83dfb68a |
grafana.additionalDataSources silently ignored — the victoria-metrics chart overrides Grafana’s datasource provisioning with its own ConfigMap, making the subchart value a no-op | Helm chart composition is leaky; the parent chart intercepts the subchart’s provisioning mechanism | Used extraConfigmapMounts to mount a standalone provisioning ConfigMap at the Pod level | bbc93d3b |
| High-cardinality node-meta labels flooded VictoriaMetrics — Cilium’s default pod metadata labels exploded metric cardinality, causing Out Of MemoryWhat the kernel does when memory runs out — it kills a process by score, not by fault. A container hitting its cgroup limit is killed the same way, which is why the victim is often not the culprit. | node-meta labels include pod IPs and container IDs — billions of unique series | Dropped high-cardinality labels via Cilium Helm value overrides | 193c3890 |
| Grafana deployment strategy defaulted to RollingUpdate — persistent PVC sometimes stuck during rolling updates due to ReadWriteOnce access mode | Grafana’s PVC is ReadWriteOnceA PVC access mode that lets exactly one node mount the volume read-write at a time. It is the reason a RollingUpdate deadlocks: the replacement pod cannot mount the volume until the outgoing pod releases it.; a rolling update can leave the old pod terminating while the new pod is pending, neither able to mount | Set Grafana.deploymentStrategy to Recreate | e40c952d |
References
- VictoriaMetrics Helm Charts — victoria-metrics-k8s-stack and victoria-logs-single
- VictoriaLogs Documentation — Ingestion API, query language, retention
- Fluent Bit Documentation — Input/filter/output plugin reference
- victoria-metrics-k8s-stack Chart — CRDs, values, components