# Observability — Metrics and Logs with VictoriaMetrics
Source: https://blog.derio.net/frank/docs/building/07-observability/
Published: 2026-03-08
Updated: 2026-09-14
A cluster without observability is a box of mystery. Pods crash silently. Memory leaks hide behind restart counts. Network blips become finger-pointing exercises. Layer 7 fixes that: a full metrics and logging stack built around VictoriaMetrics, VictoriaLogs, and Grafana, managed by ArgoCD, backed by Longhorn storage.
But three things went wrong during the deployment. A stale webhook from a reinstall completely broke resource reconciliation — objects existed but nothing happened to them. A wrong service hostname had Fluent Bit retrying silently, producing zero log data with no errors. And a Helm chart composition issue made ` additionalDataSources ` silently ignored. Each of these cost about an hour to diagnose. Documenting them here so you do not lose that hour.
A fourth turned up five months later, and it is the only one that never produced a symptom at all: the etcd scrape had been configured — by chart default, never touched — and inert since the day the cluster was built, with an ` Endpoints ` object that had been empty for 148 days behind a Service that looked entirely correct. That one is Gotcha 4, and it is the one worth reading if you run this chart on Talos.
```mermaid
flowchart LR
subgraph Sources[Data Sources]
KSM[kube-state-metrics
K8s object metrics]
NE[node-exporter
node metrics]
K8s[Kubernetes API
kubelet metrics]
FB[Fluent Bit
container logs]
end
subgraph VM[VictoriaMetrics Stack]
VMSingle[VMSingle
metrics DB]
Agent[vmagent
scraper]
Grafana[Grafana
192.168.55.203]
end
subgraph VL[VictoriaLogs]
VLSingle[VictoriaLogs
logs DB]
end
KSM --> Agent
NE --> Agent
K8s --> Agent
Agent --> VMSingle
VMSingle --> Grafana
FB --> VLSingle
VLSingle --> Grafana
```
## Why VictoriaMetrics Instead of Prometheus
The standard choice is ` kube-prometheus-stack ` — Prometheus, Alertmanager, Grafana, and a bundle of exporters. It works well, but it is heavy. On a homelab where control-plane nodes also run workloads, baseline resource consumption matters.
| Component | kube-prometheus-stack | victoria-metrics-k8s-stack |
| --- | --- | --- |
| Prometheus / VMSingle | ~1–2 GB RAM | ~50–150 MB RAM |
| Full stack baseline | ~2–4 GB RAM | ~200–400 MB RAM |
| Storage format | TSDB (Time Series Database) (**Time Series Database**A database built for timestamped numeric series. VictoriaMetrics is Frank's; the shape of the data is why it compresses so much better than a general-purpose store.) (per-sample blocks) | custom compressed format |
| Long-term retention | needs Thanos / Cortex | built-in, single binary |
VictoriaMetrics is not a drop-in replacement in the sense that it requires rethinking the architecture — but the ` victoria-metrics-k8s-stack ` Helm chart is deliberately structured to be familiar to anyone who has used ` kube-prometheus-stack `. It ships the same CRD (CustomResourceDefinition) (**CustomResourceDefinition**The object that teaches the Kubernetes API a new resource type. Install a CRD and the API server starts serving a kind it has never heard of, with validation and RBAC like any built-in.) patterns (` VMServiceMonitor `, ` VMPodMonitor `), the same Grafana dashboards, and the same exporters.
## The Stack
Four ArgoCD Applications make up the observability layer:
**` victoria-metrics `** — Core chart (` victoria-metrics-k8s-stack ` v0.72.4). Deploys:
- ` VMSingle ` — single-node time-series DB with 20Gi Longhorn PVC (PersistentVolumeClaim) (**PersistentVolumeClaim**A Kubernetes request for durable storage. The pod names a claim and the storage layer — Longhorn on Frank — binds real disk behind it, so the data outlives the pod.) , 1-month retention
- ` vmagent ` — metrics scraper; reads ` VMServiceMonitor ` and ` VMPodMonitor ` CRDs
- ` node-exporter ` — DaemonSet on all nodes
- ` kube-state-metrics ` — Kubernetes object metrics
- Grafana — with 1Gi Longhorn PVC, exposed at ` 192.168.55.203 `
**` victoria-logs `** — Separate chart (` victoria-logs-single ` v0.11.28). Single-node log storage with 20Gi Longhorn PVC, 14-day retention.
**` fluent-bit `** — DaemonSet on all nodes. Ships container logs to VictoriaLogs via HTTP jsonline.
**Note:** ` vmalert ` and ` alertmanager ` are disabled in this layer. Alerting is planned for later after rules are properly tuned.
### Deployment Details
All three Applications follow the same dual-source pattern: upstream Helm chart + Git repo for values:
```yaml
# apps/root/templates/victoria-metrics.yaml
apiVersion: argoproj.io/v1alpha1
kind: Application
metadata:
name: victoria-metrics
namespace: argocd
finalizers:
- resources-finalizer.argocd.argoproj.io
spec:
project: infrastructure
sources:
- repoURL: https://victoriametrics.github.io/helm-charts/
chart: victoria-metrics-k8s-stack
targetRevision: "0.72.4"
helm:
releaseName: victoria-metrics
valueFiles:
- $values/apps/victoria-metrics/values.yaml
- repoURL: {{ .Values.repoURL }}
targetRevision: {{ .Values.targetRevision }}
ref: values
destination:
server: {{ .Values.destination.server }}
namespace: monitoring
syncPolicy:
automated:
prune: false
selfHeal: true
syncOptions:
- ServerSideApply=true
- RespectIgnoreDifferences=true
ignoreDifferences:
- group: ""
kind: Secret
jsonPointers:
- /data
```
Two sync options matter. ` ServerSideApply=true ` avoids the 256KB annotation size limit that client-side apply hits with large Helm charts. ` RespectIgnoreDifferences=true ` works with the ` ignoreDifferences ` block to stop flagging Grafana’s auto-generated credentials Secret as drifted.
Values:
```yaml
# apps/victoria-metrics/values.yaml
vmalert:
enabled: false
alertmanager:
enabled: false
kubeControllerManager:
enabled: false # service name exceeded 63 chars
vmsingle:
spec:
retentionPeriod: "1"
storage:
storageClassName: longhorn
accessModes:
- ReadWriteOnce
resources:
requests:
storage: 20Gi
grafana:
enabled: true
service:
type: LoadBalancer
loadBalancerIP: 192.168.55.203
persistence:
enabled: true
storageClassName: longhorn
size: 1Gi
plugins:
- victoriametrics-logs-datasource
```
The ` kubeControllerManager ` scrape is disabled for an unglamorous reason: the generated service name (` victoria-metrics-victoria-metrics-k8s-stack-kube-controller-manager `) is 65 characters. Kubernetes allows 63.
## Gotcha 1: The Stale ValidatingWebhookConfiguration
This one cost about an hour.
### Symptom
After initial sync, ` VMSingle ` came up healthy. But ` vmagent ` never appeared — no Deployment, no pods, no events. ArgoCD showed ` Synced/Degraded ` with a cryptic error. ` kubectl get vmagent -n monitoring ` showed the object existed. ` kubectl describe ` showed nothing obviously wrong.
### Diagnosis
The victoria-metrics operator uses a ` ValidatingWebhookConfiguration ` to validate its custom resources. The sequence:
1. First install: operator deployed, registered webhook with its own CA bundle
2. Something went wrong mid-install (the 63-char service name issue)
3. Application was deleted and reinstalled
4. The old ` ValidatingWebhookConfiguration ` remained — not owned by the Helm release
5. The stale webhook pointed at the old operator’s TLS (Transport Layer Security) (**Transport Layer Security**The encryption under HTTPS and most other secure protocols. What a certificate is for, and what fails visibly when the certificate does not match the hostname.) certificate
6. Every API call to reconcile the ` VMAgent ` resource hit the webhook, TLS handshake failed, reconciliation silently dropped
The giveaway:
```text
Warning FailedCreate validatingwebhookconfiguration/victoria-metrics-victoria-metrics-operator-admission
x509: certificate signed by unknown authority
```
### Fix
Delete the stale webhook. The operator re-registers within seconds:
```bash
kubectl delete validatingwebhookconfiguration \
victoria-metrics-victoria-metrics-operator-admission
```
The lesson: when an operator uses admission webhooks and the install/reinstall cycle is not clean, check for stale ` ValidatingWebhookConfiguration ` objects. They survive Helm releases and cause ghost-in-the-machine behavior where objects exist but nothing happens.
## Gotcha 2: The Fluent Bit Hostname
### Symptom
Fluent Bit DaemonSet was running on all nodes. No errors in logs. But VictoriaLogs showed zero documents. Fluent Bit showed continuous retry loops: ` [engine] flush chunk ... retry=true `.
### Diagnosis
Fluent Bit’s ` [OUTPUT] ` block uses an HTTP plugin to forward logs. The ` Host ` field must resolve in-cluster. The initial config used:
```text
Host victoria-logs-victoria-logs-single.monitoring.svc.cluster.local
```
That hostname does not exist. The ` victoria-logs-single ` chart names its Service with a ` -server ` suffix: the actual name is ` victoria-logs-victoria-logs-single-server `. The chart does not document this clearly.
To find the correct name:
```bash
kubectl get svc -n monitoring | grep victoria-logs
```
```text
victoria-logs-victoria-logs-single-server ClusterIP 10.96.x.x 9428/TCP
```
### Fix
```yaml
# apps/fluent-bit/values.yaml
config:
outputs: |
[OUTPUT]
Name http
Match kube.*
Host victoria-logs-victoria-logs-single-server.monitoring.svc.cluster.local
Port 9428
URI /insert/jsonline?_stream_fields=stream,kubernetes_pod_name,kubernetes_namespace_name,kubernetes_container_name&_msg_field=log&_time_field=time
Format json_lines
Json_Date_Key time
Json_Date_Format iso8601
Retry_Limit False
```
The lesson: DNS failures in Kubernetes are silent killers. Fluent Bit does not differentiate between “server returned error” and “DNS lookup failed” in its retry output. When a log shipper shows retries with no error detail, the first check is whether the destination hostname resolves.
The Fluent Bit DaemonSet tolerates control-plane and GPU node taints to run everywhere:
```yaml
tolerations:
- key: node-role.kubernetes.io/control-plane
operator: Exists
effect: NoSchedule
- key: nvidia.com/gpu
operator: Exists
effect: NoSchedule
```
## Gotcha 3: additionalDataSources Does Not Work
### Symptom
After deploying both VictoriaMetrics and VictoriaLogs, Grafana had VictoriaMetrics pre-configured (handled by the chart), but VictoriaLogs was absent. Adding it via ` grafana.additionalDataSources ` in the victoria-metrics values had no effect regardless of how many times the Application was synced.
### Diagnosis
The ` victoria-metrics-k8s-stack ` chart manages Grafana datasource provisioning through its own ConfigMap — ` victoria-metrics-victoria-metrics-k8s-stack-grafana-ds ` — rather than delegating to the Grafana subchart’s provisioning mechanism. ` grafana.additionalDataSources `, which works by adding entries to the Grafana subchart’s own ConfigMap, is never consulted.
### Fix
A standalone provisioning ConfigMap mounted into Grafana via ` extraConfigmapMounts `:
```yaml
# apps/victoria-metrics/manifests/grafana-victorialogs-ds.yaml
apiVersion: v1
kind: ConfigMap
metadata:
name: grafana-victorialogs-datasource
namespace: monitoring
data:
victorialogs-datasource.yaml: |
apiVersion: 1
datasources:
- name: VictoriaLogs
type: victoriametrics-logs-datasource
access: proxy
url: http://victoria-logs-victoria-logs-single-server.monitoring.svc.cluster.local:9428
isDefault: false
editable: false
```
Mounted via:
```yaml
grafana:
extraConfigmapMounts:
- name: victorialogs-datasource
mountPath: /etc/grafana/provisioning/datasources/victorialogs.yaml
subPath: victorialogs-datasource.yaml
configMap: grafana-victorialogs-datasource
readOnly: true
```
The lesson: Helm chart composition is leaky. When chart A embeds chart B as a subchart, chart A can intercept anything chart B would have done. The escape hatch is ` extraConfigmapMounts ` — it operates at the Pod level and is independent of the chart’s own provisioning logic.
## Gotcha 4: The Scrape That Was Configured, and Inert, for 148 Days
Added retroactively in August 2026, five months after this layer went in. It is the most interesting of the four, because unlike the other three it produced no symptom at all — not a retry loop, not a degraded Application, not a stalled rollout. Just an absence, sitting behind a green dashboard.
### Symptom
There wasn’t one. It surfaced sideways: closing out an unrelated piece of work — a retrieval tier pinned to one of the control-plane minis — I wanted to answer “does that workload disturb the etcd quorum?” and discovered the question could not be asked. There was no etcd data. There never had been.
### Diagnosis
` kubeEtcd.enabled ` is **` true ` by default** in ` victoria-metrics-k8s-stack `, and the values above never disabled it. So the objects had existed since the cluster was built:
```text
service/…-kube-etcd ClusterIP None 2379/TCP 148d
endpoints/…-kube-etcd 148d
vmservicescrape.operator.victoriametrics.com/…-kube-etcd
```
A headless Service, a ` VMServiceScrape ` aimed at it, and an ` Endpoints ` object that had been **empty for 148 days**.
The chart’s Service selects pods labelled ` component: etcd ` — the kubeadm layout, where etcd runs as a labelled static pod. **Talos runs etcd as a host system service, not a pod.** The selector can never match. Zero endpoints, zero targets, zero series, and no error anywhere, because nothing failed: every object the chart was asked to create existed and was correct.
This is the reusable shape, and it is not specific to etcd. Any chart component that discovers its target by **pod selector** — ` kubeEtcd `, ` kubeControllerManager `, ` kubeScheduler ` — assumes a distribution whose control plane runs as labelled pods.
On Talos, exactly one of those assumptions is wrong. Talos runs kube-apiserver, kube-controller-manager and kube-scheduler as **static pods** carrying the very ` component: ` labels the chart expects, so the selector finds them and their ` Endpoints ` objects fill. **etcd is the sole component Talos runs as a host system service** — which is why it is the only one whose ` Endpoints ` object is empty.
I nearly wrote the opposite. Rendering the chart shows a selector-based Service for the scheduler and no ` Endpoints ` object beside it, which looks like the identical failure. It isn’t: **a template render can never show ` Endpoints `**, because Kubernetes creates and fills them at runtime from whatever pods match. Every selector-based component looks endpoint-less in a render, the healthy ones included. That is a second silent-absence trap stacked on the first — reasoning about presence from an artifact that structurally cannot contain the thing you’re looking for — and the only cure is to check the live cluster.
**The diagnosis is to read ` ENDPOINTS `, not the Service and not the scrape config:**
```bash
kubectl -n kube-system get endpoints | grep -E 'etcd|scheduler|controller-manager'
```
An empty ` ENDPOINTS ` column is the whole signal. ` kubectl get svc ` and ` kubectl get vmservicescrape ` both look entirely correct while it is true, which is why five months of looking at this stack never caught it.
#### And then the cluster handed me a second one
Checking that live turned up something I was not looking for. ` kube-scheduler ` has three populated endpoints — and no data either:
```text
count(up==0) by (job) -> {job="kube-scheduler"} 3
max_over_time(up{job="kube-scheduler"}[90d]) -> 0, 0, 0
{__name__=~"scheduler_.*"} -> [] (zero series)
```
Three targets, three failing scrapes, zero scheduler metrics for exactly as long as etcd went unwatched. Talos binds 10259 with TLS and authentication that the chart’s default endpoint — HTTPS with the ServiceAccount bearer token and the in-cluster CA — does not satisfy. Different mechanism, same outcome.
So “the scheduler reports into ` up ` like any other job” is literally true and about as misleading as a true sentence gets. It reports ` up=0 `.
The two failures are worth separating, because **neither diagnostic finds the other**:
| | ` kube-etcd ` | ` kube-scheduler ` |
| --- | --- | --- |
| Endpoints | empty — the selector matches nothing | populated, three addresses |
| Targets | zero | three |
| ` up ` | the series does not exist | ` 0 ` |
| Found by | ` kubectl get endpoints ` | ` up < 1 ` |
Reading ` ENDPOINTS ` catches a scrape with no targets. ` count(up==0) by (job) ` catches a scrape whose targets never answer. I had built the first check, congratulated myself, and would have missed the second one — using, as it happens, the exact query idiom this layer’s own alert rules are written in.
I have not fixed the scheduler here. It needs a decision about how to authenticate against Talos’s static-pod control plane, which is a different piece of work from a values block. It is written down instead, which is the honest state: a known gap beats an unknown one, and an unknown one is what the last five months were.
#### Why nobody noticed: the metrics that lie
The reason this survived so long is worth its own paragraph. ` etcd_* ` series **do** exist in VictoriaMetrics, and always did:
| Present the whole 148 days | Actually missing |
| --- | --- |
| ` etcd_request_duration_seconds ` | ` etcd_server_has_leader ` |
| ` etcd_request_errors_total ` | ` etcd_server_leader_changes_seen_total ` |
| ` etcd_requests_total ` | ` etcd_disk_wal_fsync_duration_seconds_bucket ` |
| ` etcd_lease_object_counts ` | ` etcd_mvcc_db_total_size_in_bytes ` |
The left column is the **apiserver’s storage client** — metrics the apiserver exports about its own calls into etcd, from inside the apiserver’s process, entirely available when etcd is not scraped at all. Grep ` etcd ` in the query UI, get hits, conclude etcd is monitored. Those series tell you the apiserver’s storage calls are slow. They cannot tell you whether the quorum has a leader.
That distinction is also the shape of the most plausible *future* mistake. When one of the new etcd alert rules eventually breaks, the fastest-looking repair is to repoint it at a metric that demonstrably has data — and every such metric is in the left column. The rule would go green while measuring the wrong process.
### Fix
Two halves, in two different worlds, connected by nothing but a port number.
**GitOps half** — a ` VMStaticScrape ` that names the three minis directly:
```yaml
# apps/victoria-metrics/manifests/vmstaticscrape-kube-etcd.yaml
apiVersion: operator.victoriametrics.com/v1beta1
kind: VMStaticScrape
metadata:
name: kube-etcd
namespace: monitoring
spec:
jobName: kube-etcd
targetEndpoints:
- targets:
- 192.168.55.21:2381 # mini-1
- 192.168.55.22:2381 # mini-2
- 192.168.55.23:2381 # mini-3
scheme: http
path: /metrics
```
The chart’s own block is switched off explicitly. Deleting it would silently restore the default, and the default is the pod selector that matches nothing:
```yaml
# apps/victoria-metrics/values.yaml
kubeEtcd:
enabled: false
```
There is no bearer token and no TLS, deliberately. The chart’s default etcd endpoint is ` scheme: https ` plus a ServiceAccount bearer token aimed at 2379, all three of which are wrong for what we are about to open.
**Talos half** — an Omni ` ConfigPatch `, scoped to the control-plane machine set, opening etcd’s dedicated metrics listener:
```yaml
cluster:
etcd:
extraArgs:
listen-metrics-urls: http://0.0.0.0:2381
```
Port 2381 rather than 2379 is the security decision. etcd serves ` /metrics ` on its client port behind mutual TLS, so scraping there means handing a scraper an etcd **client certificate** — a credential that also grants full read/write to every object in the cluster. The blast radius of that credential dwarfs the value of a latency histogram, and rotating it would become a new silent-failure surface. ` listen-metrics-urls ` is etcd’s supported alternative: plain HTTP, read-only, serving ` /metrics ` and ` /health ` only, carrying no key material. Binding ` 0.0.0.0 ` is a deliberate trade — the LAN is already this cluster’s trust boundary, and the LAN NIC is the exposed interface either way.
Those two files are applied by different tools — ` omnictl ` by hand, ArgoCD from ` main ` — and nothing else in the repo connects them. A port typo in either reproduces exactly the silent empty-target failure being fixed, so a CI tripwire parses the port out of the ConfigPatch URL, compares it against the ports the ` VMStaticScrape ` dials, and derives the three control-plane addresses from the repo’s own machine table rather than restating them.
Six Grafana rules watch the result, of which only two page: quorum has no leader, and a member is down. The other four — leader-change churn, WAL (Write-Ahead Log) (**Write-Ahead Log**Recording an intended change before making it, so a crash mid-write can be replayed rather than lost. How Postgres survives being killed.) fsync latency, database size against quota, and an ` absent() ` watchdog — go to the health bridge and stay off the phone. The watchdog exists because every one of these rules uses ` noDataState: OK `, so if the scrape ever loses its targets again the rules would all go quiet and read as healthy. ` absent() ` is the only expression that fires when a series *disappears*.
#### The first version of this fix never deployed
The GitOps half originally shipped as chart values: ` kubeEtcd.endpoints `, which makes the chart render a selector-less Service plus a **static** ` Endpoints ` object pointing at the minis. ` helm template ` rendered it perfectly. The CI tripwire passed. ArgoCD synced the merge and reported the Application ` Synced ` and ` Healthy `.
Nothing was scraped. ArgoCD’s ` resource.exclusions ` exclude ` Endpoints ` and ` EndpointSlice ` cluster-wide. Those are the argo-cd chart’s defaults, which Frank reproduces verbatim, because the control plane creates and churns those objects constantly. So ArgoCD rendered the ` Endpoints ` object and dropped it on every sync. The only trace was a condition on the Application:
```text
ExcludedResourceWarning: Resource /Endpoints victoria-metrics-victoria-metrics-k8s-stack-kube-etcd is excluded in the settings
```
The Service is not excluded, so it updated to port 2381. Its ` Endpoints ` object stayed empty. ` up{job="kube-etcd"} ` never existed, and fifteen minutes after the merge the ` absent() ` watchdog fired into the health bridge, exactly as designed.
It was the same silent empty-target failure, one layer further from the chart, and invisible to every check that reads manifests instead of the cluster. A ` VMStaticScrape ` names its own targets and is a kind ArgoCD applies, so nothing GitOps cannot deliver is left in the path. The tripwire now parses ArgoCD’s exclusion list and fails any manifest, or chart block, that depends on an excluded kind.
#### The order between the two halves is not free, and I had it backwards
The plan said, in seven places, that the two halves could land in either order: merge the values first and the target is simply down, every rule sits at ` NoData `, ` noDataState: OK `, nothing fires. Code review took that apart, and the scheduler numbers above are the proof.
**` up ` is not a series etcd exports.** The scraper *synthesises* it — one series per **configured** target, every interval, ` 1 ` on a successful scrape and ` 0 ` on a failed one. It is never absent while the target is configured. And declaring the targets is precisely what configures them. So merging the GitOps half first does not produce a quiet ` NoData ` window; it produces three targets dialling a refused port, sitting at ` up=0 `, and ` up < 1 ` at ` for: 10m ` is one of the two rules that *pages*. With the notification policy repeating every three minutes, that is Telegram going off around the clock against a perfectly healthy quorum, until someone applies a patch the plan had deliberately scheduled for afterwards.
An absent series and a series reading zero are different states, and only the first one is ` NoData `. That one word carried the whole ordering argument.
The fix is the ordering, not the alert: the ConfigPatch is harmless on its own — it opens a read-only port nothing is scraping yet — so it becomes a **pre-merge gate**. Loosening the rule instead would have bought the same quiet by discarding the signal the layer exists to add. The same asymmetry runs backwards, too: deleting the ConfigPatch alone is not a rollback, it is a pager, because the scrape’s targets survive and ` up ` goes to zero rather than away. A real rollback reverts both halves.
There is no results paragraph here yet, on purpose. The soak re-run that this unblocks — the same request volume as the original measurement, captured before and under load — has not been performed at the time of writing. When it has, the numbers belong on the curated dashboard, not in a sentence here.
### One more thing: turning the chart block off retires its extras
The chart’s ` kubeEtcd ` block also renders an upstream etcd dashboard and a 15-alert ` VMRule `. Neither has a toggle of its own; both follow ` kubeEtcd.enabled `. The ` VMRule ` was always inert here, because ` vmalert ` is disabled and alerting is Grafana-managed. The dashboard had been sitting in Grafana rendering nothing for the same 148 days.
Switching ` kubeEtcd.enabled ` off removes both from the chart’s render. The Application runs ` prune: false `, though, so their live copies stayed until they were deleted by hand, after the change synced (2026-09-14). If a board titled ` etcd ` ever reappears, it is that orphan come back, and the copy that looks canonical is the dead one. The curated board is ` Frank Layer 2 — etcd (curated) `.
## What Is Visible Now
**Grafana at ` http://192.55.203 `** ships dashboards:
- Node Exporter Full — per-node CPU, memory, disk I/O, network
- Kubernetes / Compute Resources / Cluster — cluster-wide CPU/memory requests vs usage
- Kubernetes / Compute Resources / Namespace — same per namespace
- VMAgent — internal scraping metrics
[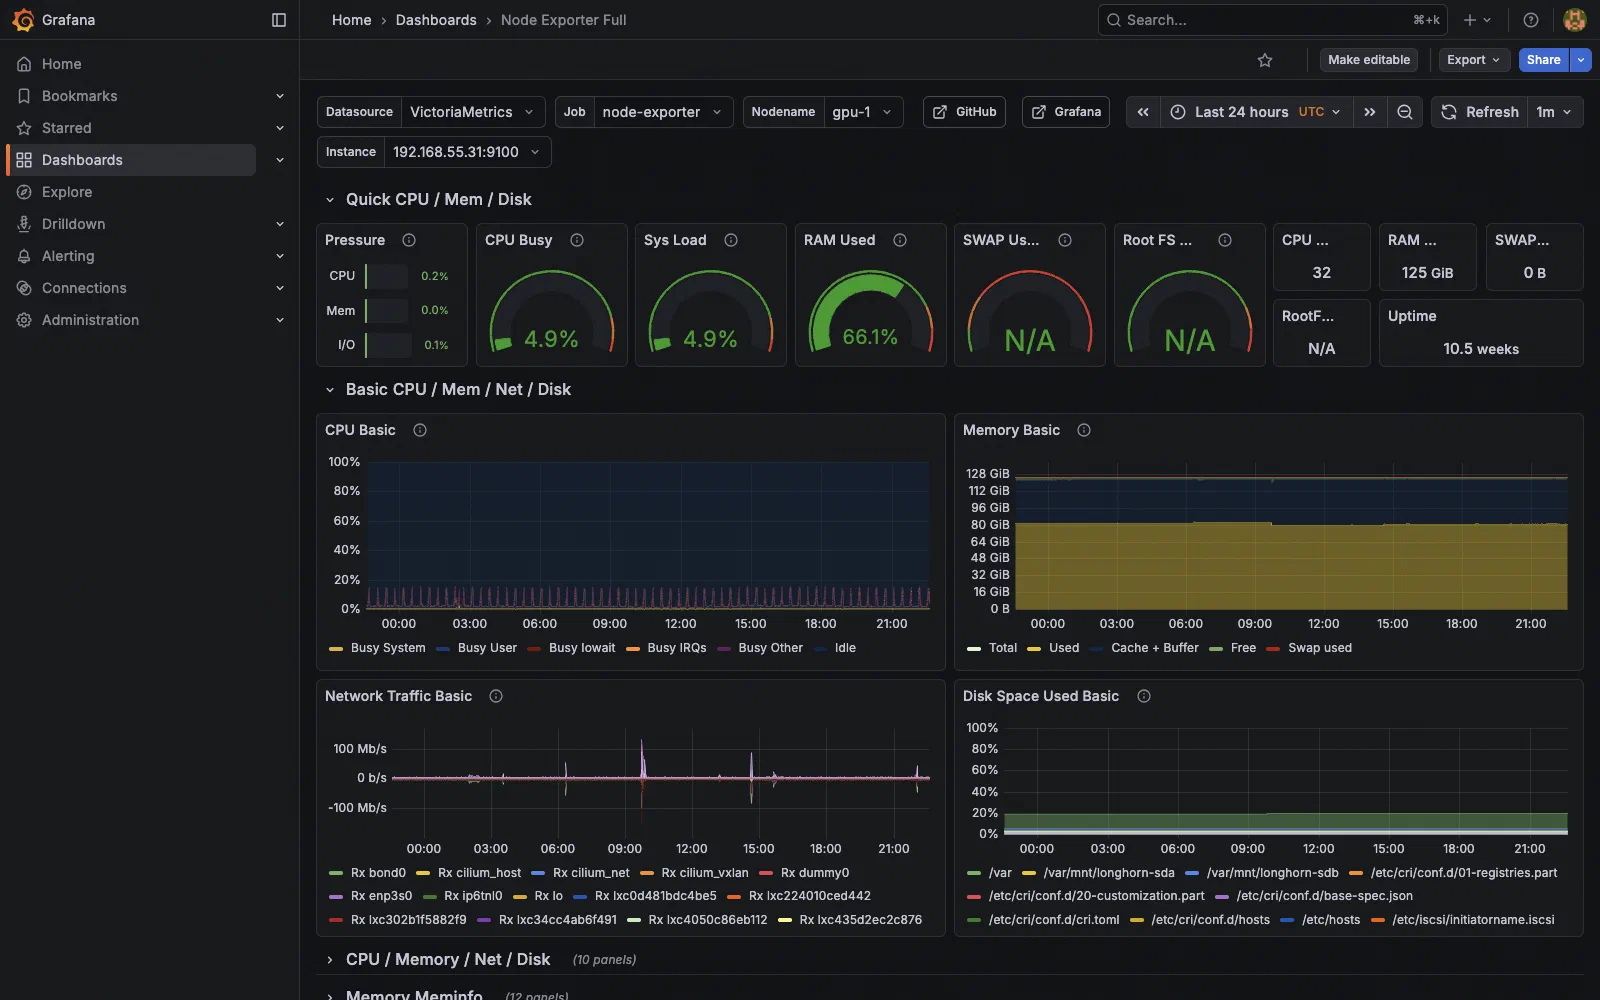](https://blog.derio.net/frank/docs/building/07-observability/grafana-node-metrics.png)
Grafana node metrics dashboard
**VictoriaLogs** is queryable via Grafana Explore:
```text
# All logs from argocd
{kubernetes_namespace_name="argocd"}
# Specific pod
{kubernetes_pod_name=~"victoria-metrics.*"}
# Error lines across cluster
{kubernetes_namespace_name=~".+"} |= "error"
```
## Missteps
| What Happened | Why It Was Wrong | How We Fixed It | Commit |
| --- | --- | --- | --- |
| **Stale ValidatingWebhookConfiguration from reinstall** — deleting and recreating the Application left the old webhook pointing at a nonexistent operator TLS cert | The webhook was not owned by the Helm release; Helm did not clean it up on uninstall | Manual ` kubectl delete validatingwebhookconfiguration `; operator re-registered with fresh cert | ` edec8a48 ` |
| **Fluent Bit hostname missing ` -server ` suffix** — the VictoriaLogs chart appends ` -server ` to its Service name, which is not documented in the chart README | Wrong DNS name caused silent retry loops with no error output; Fluent Bit retries on any transport failure without differentiating DNS from HTTP errors | Corrected ` Host ` to ` victoria-logs-victoria-logs-single-server.monitoring.svc.cluster.local ` | ` 83dfb68a ` |
| **` grafana.additionalDataSources ` silently ignored** — the victoria-metrics chart overrides Grafana’s datasource provisioning with its own ConfigMap, making the subchart value a no-op | Helm chart composition is leaky; the parent chart intercepts the subchart’s provisioning mechanism | Used ` extraConfigmapMounts ` to mount a standalone provisioning ConfigMap at the Pod level | ` bbc93d3b ` |
| **High-cardinality node-meta labels flooded VictoriaMetrics** — Cilium’s default pod metadata labels exploded metric cardinality, causing OOMs (Out Of Memory) (**Out Of Memory**What the kernel does when memory runs out — it kills a process by score, not by fault. A container hitting its cgroup limit is killed the same way, which is why the victim is often not the culprit.) | ` node-meta ` labels include pod IPs and container IDs — billions of unique series | Dropped high-cardinality labels via Cilium Helm value overrides | ` 193c3890 ` |
| **Grafana deployment strategy defaulted to RollingUpdate** — persistent PVC sometimes stuck during rolling updates due to ReadWriteOnce access mode | Grafana’s PVC is RWO (ReadWriteOnce) (**ReadWriteOnce**A PVC access mode that lets exactly one node mount the volume read-write at a time. It is the reason a RollingUpdate deadlocks: the replacement pod cannot mount the volume until the outgoing pod releases it.) ; a rolling update can leave the old pod terminating while the new pod is pending, neither able to mount | Set ` Grafana.deploymentStrategy ` to ` Recreate ` | ` e40c952d ` |
| **The etcd scrape was enabled by chart default and inert for 148 days** — a Service, a ` VMServiceScrape ` and a permanently empty ` Endpoints ` object, because the chart selects pods labelled ` component: etcd ` and Talos runs etcd as a host system service | Not a missing config — a config that was present, correct-looking and matched nothing. Nothing reports an empty ` Endpoints ` object as a fault, and the ` etcd_request_* ` series that *do* exist are the apiserver’s storage client, so grepping ` etcd ` read as coverage | A ` VMStaticScrape ` for the three minis on 2381, plus a Talos ConfigPatch opening ` listen-metrics-urls `; CI tripwire asserts the two files agree | 2026-09 |
| **The first fix never deployed** — ` kubeEtcd.endpoints ` renders a static ` Endpoints ` object, and ArgoCD’s ` resource.exclusions ` drop that kind cluster-wide | ` helm template ` and every manifest-level test passed; ArgoCD reported ` Synced/Healthy ` with only an ` ExcludedResourceWarning ` condition, so the scrape had zero targets until the ` absent() ` watchdog fired | Replaced with a ` VMStaticScrape `; the tripwire now fails any git manifest or chart block that depends on an ArgoCD-excluded kind | 2026-09 |
## References
- [VictoriaMetrics Helm Charts](https://github.com/VictoriaMetrics/helm-charts) — victoria-metrics-k8s-stack and victoria-logs-single
- [VictoriaLogs Documentation](https://docs.victoriametrics.com/victorialogs/) — Ingestion API, query language, retention
- [Fluent Bit Documentation](https://docs.fluentbit.io/) — Input/filter/output plugin reference
- [victoria-metrics-k8s-stack Chart](https://github.com/VictoriaMetrics/helm-charts/tree/master/charts/victoria-metrics-k8s-stack) — CRDs, values, components
**Next: [Backup and Disaster Recovery](https://blog.derio.net/frank/docs/building/08-backup/)**