

Progressive Delivery with Argo Rollouts
Update: 2026-05-04 — The litellm canary in this post never ran. Not once. For 39 days. The Cilium traffic-router plugin we configured was never published as a release artifact, the Argo Rollouts controller silently failed to load it on every reconciliation, and the Helm-managed Deployment quietly served traffic the entire time via what we now realize is a
workloadRef“leak”. We discovered this when we tried to use the canary for the first time, ahead of PR #210 (the LiteLLM model-list refresh). What started as “fix the broken plugin” turned into a remediation cascade that surfaced five distinct latent bugs in the deploy layer, only the first of which we’d known about. The full postmortem is in the Update section at the end of this post — including how three agents working in parallel each caught a different bug. The architecture described in the body of this post is the original design as it was deployed — it is preserved as written so the postmortem makes sense.
Every previous deployment on Frank has been a leap of faith. Push YAML, ArgoCD syncs, the old pod dies, the new pod starts. If the new version is broken, you find out when users hit errors. For a homelab that’s fine — the “users” are just me. But the whole point of this project is to learn production patterns, and production doesn’t deploy by prayer.
This post adds progressive delivery — the ability to gradually shift traffic to a new version (canary) or run two versions simultaneously and switch atomically (blue-green). Argo Rollouts provides both strategies. Cilium handles the traffic splitting. VictoriaMetrics gates promotions on real error rates. And when traffic is sparse (which is most of the time in a homelab), the system pauses and waits for the operator rather than blindly promoting or aborting.
What Is Progressive Delivery?
Traditional Kubernetes deployments are binary: old version off, new version on. Progressive delivery adds intermediate states:
Canary shifts a percentage of traffic to the new version. If metrics look good, the percentage increases. If metrics are bad, traffic reverts to the old version. The old version stays live the entire time — users on the stable path never notice.
Blue-green runs two full environments simultaneously. The “blue” (active) environment serves all traffic while the “green” (preview) environment starts up and gets smoke-tested. When you’re confident in green, traffic switches atomically. If green is broken, blue is still there — instant rollback.
Both strategies require something a standard Deployment can’t do: manage two ReplicaSets simultaneously with traffic control between them.
Architecture
Argo Rollouts installs as a controller in its own namespace. It watches Rollout CRDs cluster-wide and manages pod lifecycles, traffic splitting, and metric-gated promotions.
argo-rollouts namespace
  └── argo-rollouts controller + Cilium traffic router plugin

litellm namespace
  └── Rollout/litellm (canary via workloadRef → Deployment/litellm)
      ├── stable service: litellm (LB 192.168.55.206)
      ├── canary service: litellm-canary (ClusterIP)
      ├── Cilium CiliumEnvoyConfig (traffic weights)
      └── AnalysisTemplate: VictoriaMetrics error rate

sympozium-system namespace
  └── Rollout/sympozium-apiserver (blue-green via workloadRef)
      ├── active service: sympozium-apiserver-lb (LB 192.168.55.207)
      ├── preview service: sympozium-apiserver-preview (ClusterIP)
      └── AnalysisTemplate: HTTP healthcheck on /healthz
Phase 1: Controller Install
The controller is a standard Helm chart from the Argo project:
# apps/argo-rollouts/values.yaml
controller:
  replicas: 1
dashboard:
  enabled: false
notifications:
  enabled: false
Two ArgoCD Applications handle deployment: argo-rollouts for the Helm chart and argo-rollouts-extras for supplemental manifests (plugin config and RBAC).
Cilium Traffic Router Plugin
Argo Rollouts uses plugins for traffic management. The Cilium plugin creates CiliumEnvoyConfig objects that split traffic between stable and canary services at the L7/Envoy level. The controller downloads the plugin binary on first startup from a pinned GitHub release URL:
# apps/argo-rollouts-extras/manifests/plugin-config.yaml
apiVersion: v1
kind: ConfigMap
metadata:
  name: argo-rollouts-config
  namespace: argo-rollouts
data:
  trafficRouterPlugins: |-
    - name: "argoproj-labs/cilium"
      location: "https://github.com/argoproj-labs/rollouts-plugin-trafficrouter-cilium/releases/download/v0.4.1/..."
The default Helm chart RBAC doesn’t include Cilium CRD permissions, so a supplemental ClusterRole grants the controller access to ciliumenvoyconfigs:
# apps/argo-rollouts-extras/manifests/cilium-rbac.yaml
apiVersion: rbac.authorization.k8s.io/v1
kind: ClusterRole
metadata:
  name: argo-rollouts-cilium
rules:
  - apiGroups: ["cilium.io"]
    resources: ["ciliumenvoyconfigs"]
    verbs: ["get", "list", "watch", "create", "update", "patch", "delete"]
Phase 2: LiteLLM Canary
The workloadRef Pattern
LiteLLM is deployed via a Helm chart that owns its Deployment. Rather than forking the chart to add Rollout support, we use Argo Rollouts’ workloadRef feature: a Rollout object references the Helm chart’s Deployment by name. The Rollout controller reads the pod template from the Deployment, scales the Deployment to 0, and takes over pod management.
This is the key insight: the Helm chart stays the source of truth for application configuration. The Rollout adds progressive delivery on top without modifying the chart at all. When the chart’s Deployment spec changes (e.g., a version bump in values.yaml), the Rollout detects it and initiates a canary.
Image Tag Pinning
The original values.yaml used tag: main-stable with pullPolicy: Always. This makes canary deployment non-deterministic — the “new” version might be the same image as the “old” version, just re-pulled. Pinning to a specific tag (main-v1.82.3-stable) makes each version change explicit and trackable.
Canary Steps
strategy:
  canary:
    stableService: litellm
    canaryService: litellm-canary
    trafficRouting:
      plugins:
        argoproj-labs/cilium: {}
    steps:
      - setWeight: 20
      - pause: {}
      - analysis:
          templates:
            - templateName: litellm-error-rate
      - setWeight: 50
      - pause: {}
      - analysis:
          templates:
            - templateName: litellm-error-rate
Each pause: {} step waits for manual promotion (kubectl argo rollouts promote litellm -n litellm). This is intentional for a homelab: you wait until consumers (Paperclip, Sympozium) are actually generating traffic before running the analysis step. In a production environment with constant traffic, you’d replace these with timed pauses.
VictoriaMetrics Analysis
The AnalysisTemplate queries VictoriaMetrics (which exposes a Prometheus-compatible API) for the LiteLLM error rate:
spec:
  metrics:
    - name: error-rate
      interval: 1m
      count: 5
      inconclusiveLimit: 3
      successCondition: "result[0] < 0.05"
      failureCondition: "result[0] >= 0.05"
      provider:
        prometheus:
          address: "http://vmsingle-victoria-metrics-victoria-metrics-k8s-stack.monitoring.svc.cluster.local:8428"
          query: |
            sum(rate(litellm_request_total{status=~"5.."}[5m]))
            /
            sum(rate(litellm_request_total[5m]))
If the error rate exceeds 5%, the canary aborts and traffic reverts to the stable version. If there’s zero traffic (the query returns NaN), the result matches neither successCondition nor failureCondition — Argo Rollouts treats this as inconclusive. After 3 consecutive inconclusive results (15 minutes of silence), the analysis aborts and the Rollout pauses indefinitely. The operator then decides: wait for traffic, force-promote, or abort.
ArgoCD Integration
The workloadRef pattern requires one ArgoCD configuration: the Rollout controller scales the Helm chart’s Deployment to 0 replicas, but ArgoCD sees the desired replica count from the chart values and tries to reconcile it back. Adding ignoreDifferences on spec.replicas for the Deployment prevents this fight:
ignoreDifferences:
  - group: apps
    kind: Deployment
    name: litellm
    namespace: litellm
    jsonPointers:
      - /spec/replicas
Phase 3: Sympozium Blue-Green
Why Sympozium
Sympozium’s API server is fully stateless — all persistent state lives in the NATS JetStream StatefulSet. The web UI pod serves on port 8080 with no local storage, making it an ideal blue-green candidate.
Paperclip was originally considered but has a RWO PVC that prevents running two copies simultaneously. Argo Rollouts has no recreate strategy either — only canary and blueGreen — so Paperclip stays as a plain Deployment. See the gotchas section for details.
Blue-Green Strategy
strategy:
  blueGreen:
    activeService: sympozium-apiserver-lb
    previewService: sympozium-apiserver-preview
    autoPromotionEnabled: false
    prePromotionAnalysis:
      templates:
        - templateName: sympozium-health
The Rollout controller starts the green stack, runs a pre-promotion health analysis (HTTP GET on /healthz via the preview service), and then waits for manual promotion. The active LB service continues serving blue the entire time.
Unlike canary, blue-green also requires ignoreDifferences on the service selectors — the Rollout controller adds a rollouts-pod-template-hash label to the active and preview service selectors to route traffic to the correct ReplicaSet.
Operating Rollouts
Canary Commands (LiteLLM)
# Watch rollout status
kubectl argo rollouts get rollout litellm -n litellm --watch

# Advance past a pause step
kubectl argo rollouts promote litellm -n litellm

# Abort and roll back to stable
kubectl argo rollouts abort litellm -n litellm

# Force promote to 100% (skip remaining steps)
kubectl argo rollouts promote litellm -n litellm --full
Blue-Green Commands (Sympozium)
# Watch rollout status
kubectl argo rollouts get rollout sympozium-apiserver -n sympozium-system --watch

# Promote green to active
kubectl argo rollouts promote sympozium-apiserver -n sympozium-system

# Abort — keeps blue as active, tears down green
kubectl argo rollouts abort sympozium-apiserver -n sympozium-system
Manual Operations
Install kubectl-argo-rollouts Plugin
# manual-operation
id: deploy-install-kubectl-plugin
layer: deploy
app: argo-rollouts
plan: docs/superpowers/specs/2026-03-25--deploy--argo-rollouts-design.md
when: After controller is deployed — before operating any rollouts
why_manual: CLI plugin is a local developer tool, not a cluster resource
commands:
  - "curl -LO https://github.com/argoproj/argo-rollouts/releases/latest/download/kubectl-argo-rollouts-darwin-amd64"
  - "chmod +x kubectl-argo-rollouts-darwin-amd64 && sudo mv kubectl-argo-rollouts-darwin-amd64 /usr/local/bin/kubectl-argo-rollouts"
verify:
  - "kubectl argo rollouts version"
status: done
Gotchas
- Argo Rollouts only supports
canaryandblueGreen— there is norecreatestrategy. Stateful apps with RWO PVCs that need Recreate behavior must stay as plain Deployments. AnalysisTemplatehas noinconclusiveConditionfield — NaN results implicitly match neithersuccessConditionnorfailureConditionand are automatically treated as inconclusive. We discovered this the hard way when the ServerSideApply rejected the manifest.- Prometheus conditions use
result[0]— scalar query results require array indexing syntax, not bareresult. workloadRefscales the Deployment to 0 — this is expected. The Rollout controller manages pods directly. ArgoCD needsignoreDifferencesonspec.replicasto avoid fighting.- Blue-green modifies service selectors — the Rollout controller adds
rollouts-pod-template-hashlabels. ArgoCD needsignoreDifferencesonspec.selectorfor the service resources plusRespectIgnoreDifferences=truein the sync options. - Cilium plugin downloads at controller startup — requires internet access on first boot. Subsequent restarts use the cached binary. (2026-05-04: this gotcha is the surface symptom; the underlying problem is that the plugin URL 404s — see the Update section below.)
- Pin the image tag —
pullPolicy: Alwayswith a mutable tag makes canary non-deterministic.
Update: 2026-05-04 — The Canary That Wasn’t
This post was published with confidence on 2026-03-27. The architecture described above was deployed, ArgoCD reported Synced/Healthy, and the operating companion post was published the same day with day-to-day commands. We marked the layer Deployed in the plan and moved on.
Then, on 2026-05-04, we tried to use the canary for the first time. We were about to merge the LiteLLM model-list refresh (a 1.82.3 → 1.83.14 image bump plus a swap of five local Ollama tags and three OpenRouter aliases) and we wanted progressive-delivery safety on what was the largest LiteLLM change in months. We wrote a 200-line operational runbook (docs/runbooks/litellm-canary-observation.md), spun up the three observation terminals, and ran pre-flight.
The pre-flight returned this:
$ kubectl argo rollouts get rollout litellm -n litellm
Status:          ◌ Progressing
Message:         waiting for rollout spec update to be observed
Strategy:        Canary
  Step:          0/6
  SetWeight:     20
  ActualWeight:  0
Replicas:
  Desired:       1
  Current:       0
  Updated:       0
  Ready:         0
  Available:     0
If you go look at the operating companion post, you will find this exact output pasted in as a sample of normal “Progressing” state. We literally had a screenshot of the failure mode in our docs, captioned as the happy path, for 39 days.
What was actually happening
argoproj-labs/cilium— the traffic-router plugin we configured the Argo Rollouts controller to download — was never published as a release artifact. The pinned download URL returned 404. Always had.The controller crash-looped for 21 days trying to bootstrap the plugin. We surgically fixed that on 2026-04-30 (commit
b3f8623 fix(gitops): drop broken cilium trafficRouterPlugin from argo-rollouts) by removing the plugin entry from the controller’s ConfigMap. The controller started cleanly after that.But we never removed the matching
trafficRouting.plugins.argoproj-labs/cilium: {}reference from the litellmRolloutspec. So every reconciliation now ended with:failed to get traffic router plugin argoproj-labs/cilium: unable to find plugin (argoproj-labs/cilium): plugin argoproj-labs/cilium not configured in configmapAt the moment of discovery, the retry counter on this error was 10,957 — every 10 seconds for the previous 30 hours, and that’s just the count since the last controller restart.
The controller could not advance reconciliation past traffic-router init, so it never invoked
workloadRefto scale the Helm-managedDeployment/litellmto 0. The Helm Deployment kept running its single pod, served by apod-template-hashReplicaSet (norollouts-pod-template-hash), with full traffic going to it via thelitellmService at192.168.55.206:4000.ArgoCD reported
Synced/Healthybecause its contract — “the manifests in git are applied to the cluster” — was satisfied. The Rollout existed. The Deployment existed. The Services existed. The AnalysisTemplate existed. Nothing was missing or broken from ArgoCD’s perspective. The fact that the Rollout controller couldn’t actually use any of it was outside ArgoCD’s awareness.Every LiteLLM image bump in the intervening 39 days — there were a few — was a vanilla
RollingUpdateperformed by the Deployment controller, masquerading in the codebase as a canary.
Why nothing failed loudly
This is the part that bothers me most. Three independent observability channels each gave us a green light when we should have been screaming:
- ArgoCD app health. Synced and Healthy throughout. The app’s contract is “manifests apply”; “the workflow the manifests describe actually executes” is not a thing ArgoCD measures.
- Pod liveness. A LiteLLM pod was always running. Probes passed. Consumers (ruflo, paperclip, n8n) hit the Service and got responses. There was no “broken canary” to alert on because there was no canary.
kubectl argo rollouts get. ReturnedProgressingwithStep: 0/6— and the messagewaiting for rollout spec update to be observedis genuinely how a healthy Rollout idles between deploys. The error was buried in the controller pod’s logs, not in any object’s.statuswe ever looked at.
Combine those three with the documented sample output in our own operating post, and the failure was indistinguishable from steady state to anyone not actively trying to drive a canary through it. We weren’t trying to drive a canary through it. We had no reason to. Until PR #210.
The fix: replica-count canary
The Cilium traffic-router plugin doesn’t exist. None of the published Argo Rollouts traffic routers (Istio, Linkerd/SMI, NGINX, Traefik, ALB, Apisix, AppMesh) line up with how Frank actually exposes LiteLLM — the gateway lives behind a raw Cilium L2 LoadBalancer (192.168.55.206) for in-cluster consumers and behind a Traefik IngressRoute (litellm.cluster.derio.net) for browser access. A Traefik-based traffic-router would mutate the IngressRoute weights, but it would only catch the small slice of traffic that humans send to the FQDN. The actual consumer traffic — every OPENAI_BASE_URL=http://litellm.litellm.svc:4000 — goes through the in-cluster ClusterIP and would bypass the canary entirely.
The honest answer is replica-count canary: drop trafficRouting, drop the optional stableService and canaryService references, bump replicas: 1 → 5 so setWeight: 20 rounds cleanly to 1 canary + 4 stable and setWeight: 50 to 3 canary + 2 stable. The chart’s Service/litellm selects all pods labeled with the app’s standard labels — both stable and canary RSes inherit those labels from the Deployment template — so kube-proxy/Cilium endpoint selection round-robins across the union, naturally weighted by pod count. Every consumer path (LB, ClusterIP, IngressRoute) sees the same proportion. Pause/analysis/promote semantics stay intact.
The new Rollout spec is barely 30 lines. The diff against the original is mostly deletions:
-      stableService: litellm
-      canaryService: litellm-canary
-      trafficRouting:
-        plugins:
-          argoproj-labs/cilium: {}
       steps:
         - setWeight: 20
We also deleted apps/litellm/manifests/service-canary.yaml (the L7-split sidecar Service that’s now meaningless) and apps/argo-rollouts-extras/manifests/cilium-rbac.yaml (the ClusterRole granting CiliumEnvoyConfig access to a plugin that never loaded). The runbook was rewritten from scratch to describe pod-distribution observability instead of CiliumEnvoyConfig weight inspection.
The lesson: declarative ≠ tested
I want to be careful here. The mistake wasn’t the choice of plugin (a reasonable bet that didn’t pan out), and it wasn’t the operational discipline (the team did notice the controller crash-loop and did surgically fix it on 2026-04-30). The mistake was declaring the layer Deployed without ever exercising the workflow it described.
“Deployed” was assigned based on:
- Manifests applied (yes).
- ArgoCD Synced/Healthy (yes).
- Controller running (yes, after the 2026-04-30 patch).
- A canary actually executing end-to-end through pause → analysis → promote (no — this was never tested).
That last bullet is the one that proves the feature works. The first three only prove that the artifacts of the feature exist in the cluster. They are necessary, but they are not sufficient. ArgoCD’s contract is “the cluster matches the desired state in git”; it has nothing to say about whether the workflow your manifests describe actually runs when triggered. Test infrastructure can have the same blind spot — a green CI run on a manifest doesn’t prove the runtime behavior the manifest is supposed to enable.
The corrective practice, going forward, for any layer that introduces a workflow rather than just a workload:
- Don’t mark a layer Deployed until the workflow has been triggered, observed end-to-end, and the observed behavior matches the documented behavior. For the canary specifically: trigger a real image bump, watch the canary go 0% → 20% → pause → analysis → promote → 50% → pause → analysis → promote → 100%, abort once and re-roll, and confirm the AnalysisRun fired with non-NaN data. Then mark it Deployed.
- Treat the operating runbook as a test plan, not just documentation. If you can’t follow your own runbook against the live cluster and have it produce the documented output, the runbook is a wishlist.
- Sample outputs in docs come from real runs, not from the expected shape of a real run. The “exact failure-mode pasted as the happy path” trap is only avoidable if the sample is a captured copy-paste of a known-good execution, not a typed-up reconstruction.
The fact that this kind of self-deception is so easy is itself the lesson. Three independent green lights, two blog posts, one runbook, 39 days. Frank has opinions, and one of them is now: the only proof of a feature is the manual signoff that a human actually ran it through. Every prior layer in this series should be re-asked the question “has the workflow this layer adds been exercised end-to-end since deploy?” — and where the answer is “no” or “I’m not sure”, that’s a follow-up.
PR #210 was supposed to become the first real canary run in cluster history. What actually happened next was even better material for the postmortem, and is the rest of this update.
Postscript: 2026-05-04 (continued) — Four more bugs
After the Cilium-plugin fix landed (PR #213) and we started observing what we thought was the first real canary, the rehearsal kept finding new problems. By the end of the day we’d discovered four more latent bugs that had been sitting in the deploy layer for 39 days, each one masked by the one we’d just fixed. The cascade ran like this:
Bug #2 (caught in code review of PR #213) — over-broad canary Service selector
The service-canary.yaml we’d shipped in 2026-03 had a selector of {app.kubernetes.io/name: litellm, app.kubernetes.io/instance: litellm} — no template-hash discrimination. Argo Rollouts’ Cilium plugin was supposed to mutate that selector at runtime to add rollouts-pod-template-hash, but only when trafficRouting was active and the plugin loaded. Since the plugin never loaded, the selector was never mutated. If the L7 design had worked, the canary Service would have selected all litellm pods (stable + canary), double-counting traffic in both Service paths. Two latent bugs lived inside one Service definition. The PR #213 deletion fixes both at once. Caught by an attentive code review, not by runtime evidence.
Bug #3 (PR #214) — workloadRef.scaleDown defaults to never, not onsuccess
After PR #213 landed and the controller could finally take ownership, we expected Deployment/litellm to scale to 0 (the workloadRef invariant). It didn’t. Live state was 6 pods: 5 from the new Rollout-managed RS plus 1 still on the old Helm-managed RS. The chart-default Deployment.spec.replicas: 1 stayed at 1 because the Rollout never told the Deployment to scale down. Argo Rollouts’ workloadRef.scaleDown field defaults to never; we’d assumed onsuccess. Same false memory was in our own frank-gotchas.md (“Argo Rollouts workloadRef scales the referenced Deployment to 0…”), which we updated. PR #214 added the missing field; the controller scaled the Helm Deployment to 0 within seconds.
Bug #4 (PR #216) — AnalysisTemplate query missed all 4xx errors
This one came from Terminal #3 (the synthetic-traffic agent). They drove ~1 req/sec at the LiteLLM LB to keep the upcoming AnalysisRun out of NaN territory, picked mistral-small arbitrarily as the model alias, and got 0 success / 114 requests — all 404 + 429 from OpenRouter’s :free-tier upstream which had silently broken. Then they noted the implication for our AnalysisTemplate: the query was litellm_request_total{status=~"5.."} / litellm_request_total — only counting 5xx as failures. A canary serving 100% 4xx would evaluate as 0 / 114 = 0% error rate, well under our 5% threshold, and be auto-promoted as healthy. Silent green-light on a canary that was completely broken to consumers. PR #216 fixed the query to status!~"2..|3.." (anything not 2xx success or 3xx redirect counts as a canary error).
Bug #5 (PR #217) — the metric source we wired to doesn’t exist on this cluster
After PR #216 we tried the canary again. The AnalysisRun fired, then immediately started panicking with reflect: slice index out of range from Argo Rollouts’ Prometheus provider. Five consecutive Errors at 10s cadence (not the configured 1m — Errors retry faster), the controller hit consecutiveErrorLimit: 4, and aborted the canary cleanly. The actual kubectl argo rollouts get output at the moment of abort:
$ kubectl argo rollouts get rollout litellm -n litellm
Status:          ✖ Degraded
Message:         RolloutAborted: Rollout aborted update to revision 2: Metric "error-rate" assessed Error due to consecutiveErrors (5) > consecutiveErrorLimit (4): "Error Message: reflect: slice index out of range"
Strategy:        Canary
  Step:          0/6
  SetWeight:     0
  ActualWeight:  0
Replicas:
  Desired:       5
  Current:       5
  Updated:       0
  Ready:         5
  Available:     5

NAME                                 KIND         STATUS        AGE    INFO
⟳ litellm                            Rollout      ✖ Degraded    39d
├──# revision:2
│  ├──⧉ litellm-67b4ccbdb4           ReplicaSet   • ScaledDown  11m    canary
│  └──α litellm-67b4ccbdb4-2-2       AnalysisRun  ⚠ Error       2m24s  ⚠ 5
└──# revision:1
   └──⧉ litellm-79db46b9fc           ReplicaSet   ✔ Healthy     39d    stable
Note Updated: 0 and the canary RS at • ScaledDown — the controller correctly walked the canary back to zero pods and returned the full 5/5 to the original stable RS. Available: 5, traffic uninterrupted to consumers. The error message names the precise cause and the precise underlying panic.
Investigation: litellm_request_total doesn’t exist in VictoriaMetrics at all. The OSS LiteLLM image doesn’t expose /metrics (Prometheus integration is a paid Enterprise feature on LiteLLM), the chart’s Service has no metrics port, and we’d never added a ServiceMonitor or VMServiceScrape. The original AnalysisTemplate from 2026-03-25 was wired to a metric source that was never present on this cluster. The empty result vector caused the Prometheus provider to panic on result[0] (no bounds check), controller treated panic as Error, hit the limit, fail-closed-aborted.
PR #217 disabled the AnalysisRun steps entirely and replaced them with manual pause: {} gates — no metric-gating until a real signal source lands. Path B is brainstormed in the metric-source design spec — three concrete options with trade-off matrix. The most attractive of the three is also the smallest in code: a sidecar exporter that tails LiteLLM’s stdout JSON access logs and emits the same metric names our existing AnalysisTemplate already references. About 50 lines of Python, sketched by Terminal #3 during the discussion:
import json, sys
from prometheus_client import Counter, start_http_server

req = Counter("litellm_request_total", "Requests",
              ["model", "status", "api_user"])
start_http_server(9090)
for line in sys.stdin:
    try:
        e = json.loads(line)
        if e.get("event") == "request_completed":
            req.labels(e["model"], str(e["status_code"]),
                       e.get("api_user", "anon")).inc()
    except (ValueError, KeyError): pass
It carries the exact metric name our existing AnalysisTemplate references — so once deployed, the AR query needs no change. Per-pod by construction (each sidecar emits its own pod’s traffic). Per-model labelling closes the “single-model probing has a blind spot” concern (more on that below). Implementation when chosen — see the spec for the full hybrid recommendation that pairs this with Cilium Hubble L7 stats for defence-in-depth on the request paths the sidecar can’t see.
The recurring pattern: every fix exposed the next bug. With the Cilium plugin broken, the controller never tried to scale the Helm Deployment, so we didn’t notice workloadRef.scaleDown was wrong. With scaleDown: never, the controller never advanced reconciliation to the AnalysisRun, so we didn’t notice the query was 5xx-only-blind. With the 5xx-only query, the AnalysisRun never actually queried VictoriaMetrics under traffic conditions, so we didn’t notice the metric was missing entirely. The pause-only canary that landed in PR #217 is the working version. It completed two end-to-end round-trips (PR #215 added a synthetic env-var to trigger the canary; PR #218 reverted it for the round-trip), and the captured outputs at each pause are in /tmp/frank-canary-captures/ — pasted into the rewritten operating runbook as real samples (no more fabricated “expected shape” output).
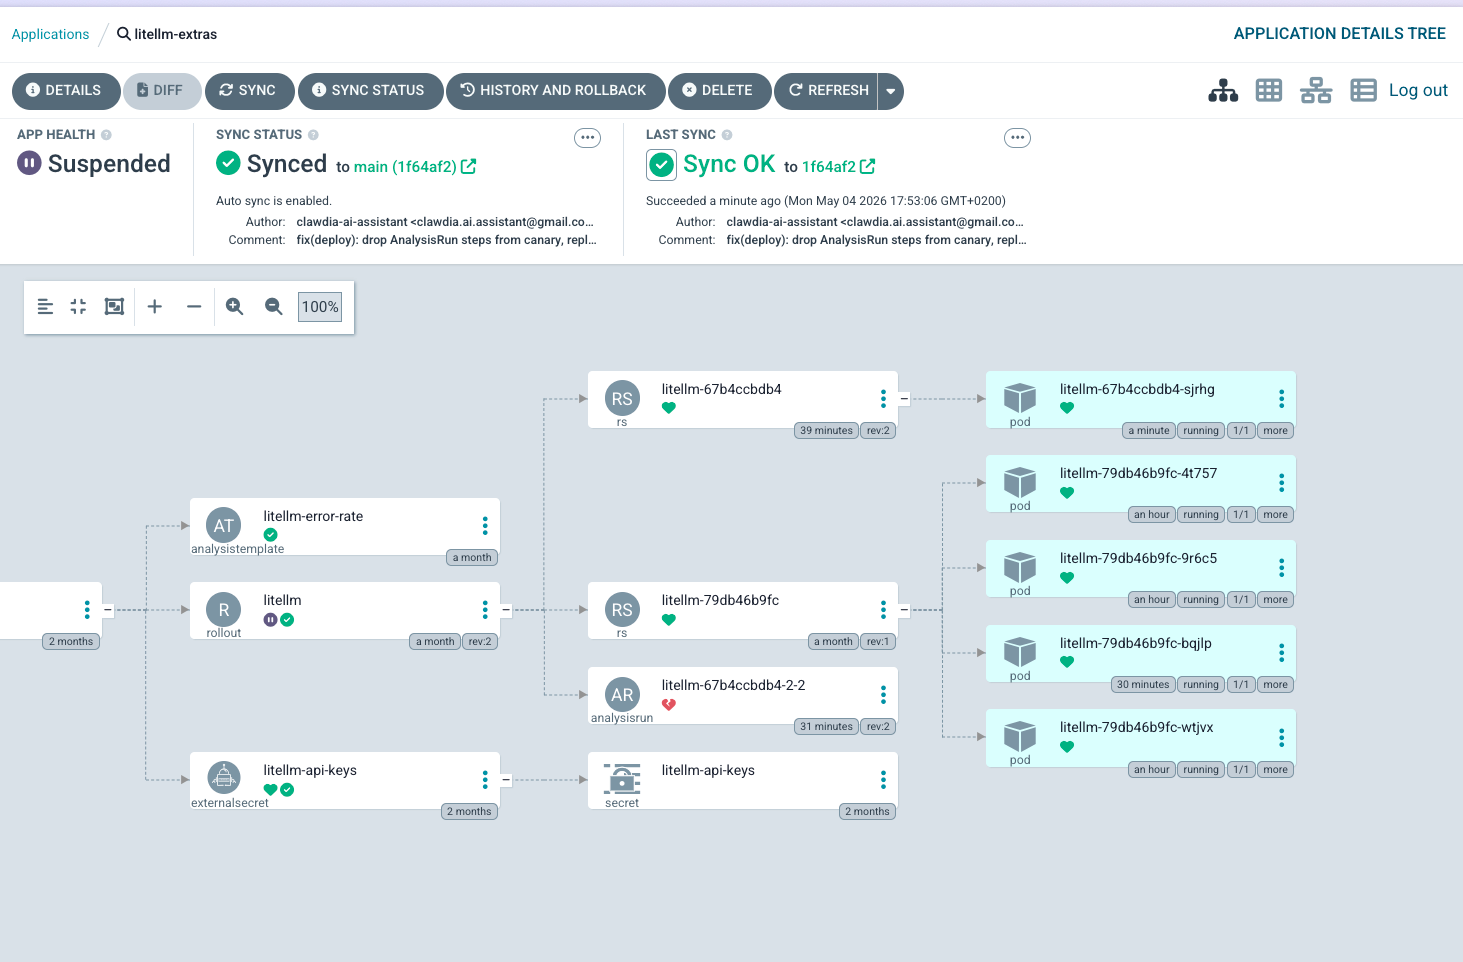
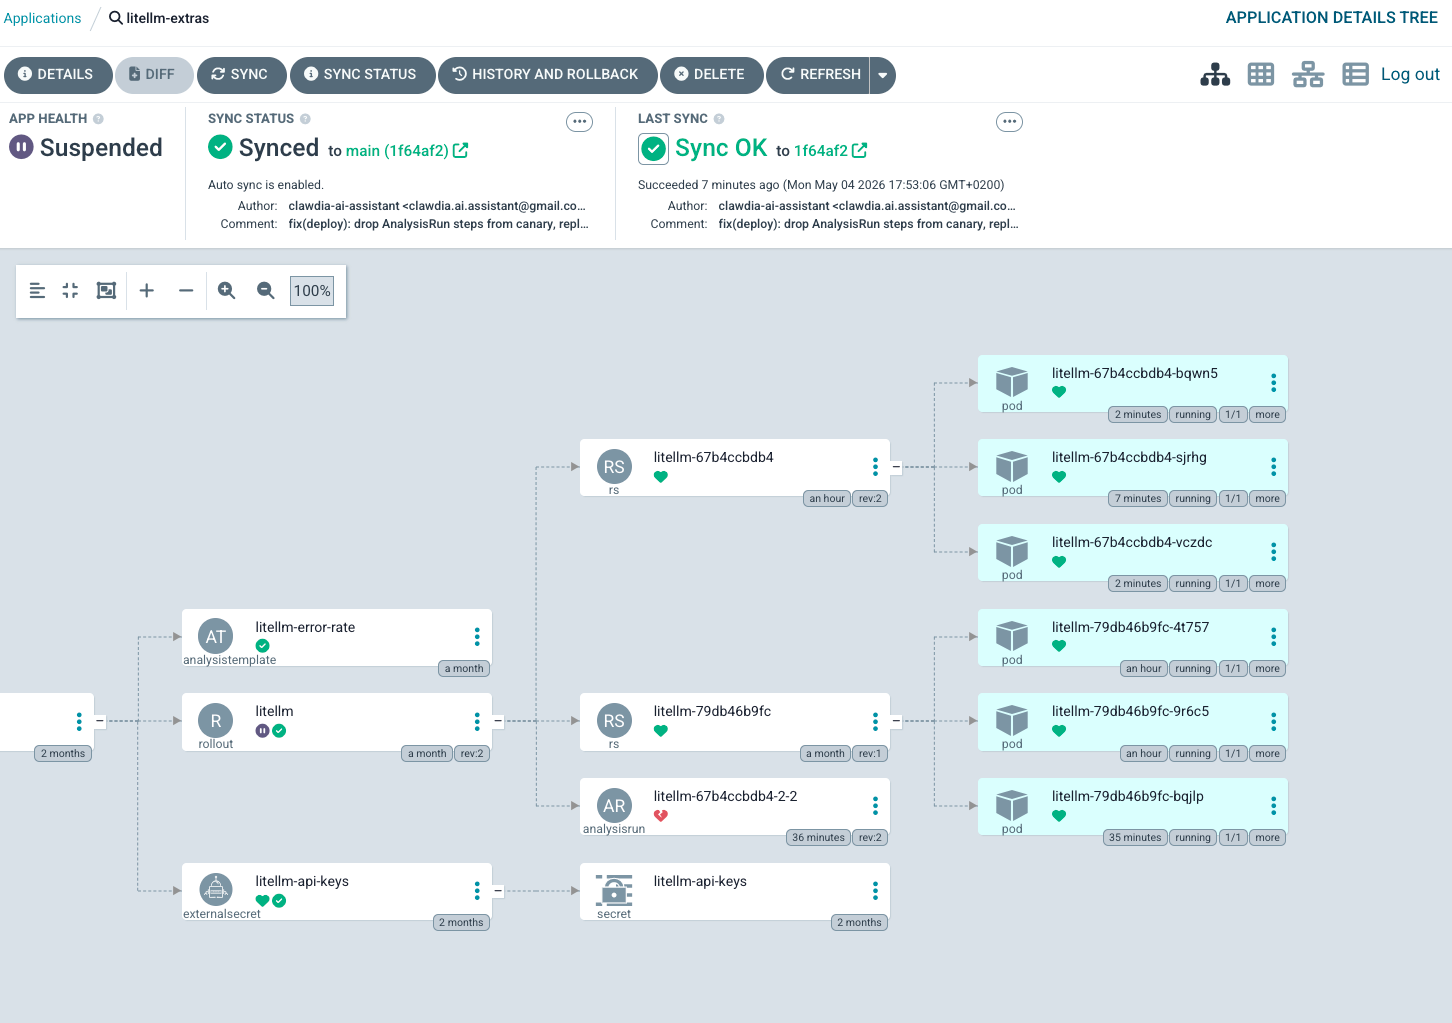
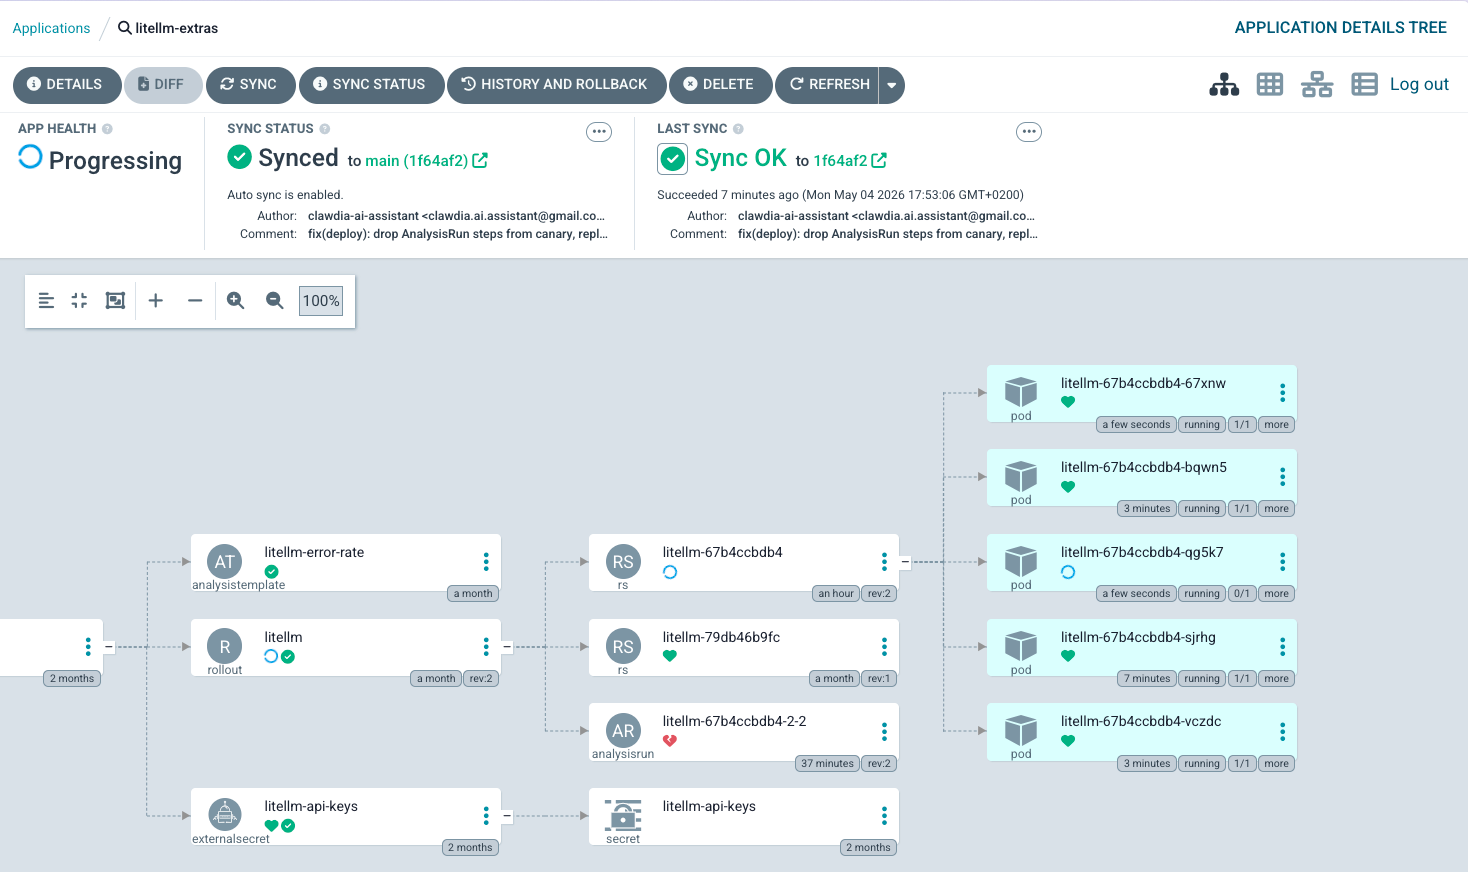
Here’s what the working canary actually looks like in the ArgoCD UI, in three frames — the first visual evidence of this layer’s progressive-delivery feature being exercised end-to-end since deploy.
What worked, throughout, despite all the breakage: Argo Rollouts itself fail-closed every time. When the Cilium plugin couldn’t load, the canary stalled at Step 0 with no progression — no silent partial-promotion. When the AnalysisRun panicked on the empty metric vector, the controller treated panic as Error and aborted the canary after 5 consecutive errors. When workloadRef.scaleDown: never left the Helm Deployment running alongside, traffic continued to flow (just to 6 pods instead of 5) — no consumer-visible failure. Every failure mode the cascade discovered ended in “the system is conservative when uncertain.” That property held across five distinct types of broken state, which is the strongest endorsement of the framework I have to give from this experience.
Postscript: How three agents found four of the five bugs in a single afternoon
The cascade wasn’t done by one observer. The operator opened a multi-agent collaboration channel (docs/agentic-discussion/2026-05-04--litellm-canary/<terminal>.md, append-only, all agents read all files) so three observers — each in a different role — could compare notes directly without the operator having to relay every signal between them. The folder is timestamped + theme-prefixed so future cascades get their own subdir without colliding.
Terminal #1 (the rollout-pipeline coordinator, this post’s author) drove the PRs and ran
kubectl argo rollouts get. Found Bug #5 (missing metric source) by probing VictoriaMetrics directly when the AnalysisRun started panicking. Initially mis-diagnosed Bug #4 (the empty-vector panic) as caused by PR #216’s query change; corrected when the multi-agent discussion surfaced the deeper “metric was never there” framing.Terminal #2 (the data-plane observer) ran
kubectl get pods/rs/events --watchagainst the litellm namespace at 3-second polling. Their event timeline for the first canary cycle, lifted verbatim fromterminal-2.md:Local time Event 17:05:30 T0 baseline. 5 stable on RS 79db46b9fc, one pod per node. RolloutHealthy, step 6/6, weight 100/100. The 39-day-stuck Progressing state is gone — PR #213 was the unstick.17:07:35Z ArgoCD sync operation started. Phase Running. Blocked on PreSync hook Job/litellm-migrations.17:11:14Z Migration pod scheduled to raspi-1 (arm64). Image pull took 3m53s (714 MB ARM layer cold). 17:13:20Z prisma migrate deploy→ “No pending migrations”. Then post-migration sanity check detected schema drift, auto-generated20260504151320_baseline_diff/migration.sql, applied it viaprisma db execute. Data-state-mutating, not just code-state-mutating.17:15:04 Canary RS litellm-67b4ccbdb4created atreplicas: 1. Stable RS scaled 5 → 4. Ghost RSlitellm-c78cd66fdalso appeared atreplicas: 0(probably double-render of the Deployment template during sync).17:15:23 Canary pod Ready 1/1on mini-3. Rollout phasePausedat step 1/6, ActualWeight 20. Math check:ceil(20 × 5 / 100) = 1✅.~17:23:51Z AnalysisRun litellm-67b4ccbdb4-2-2started.17:24:31Z 5 consecutive Errormeasurements at 10s cadence. Rollout aborted. All replicas back to stable.Three independent findings emerged from that log:
The runbook was wrong about the failure mode. Original runbook claim: zero traffic → NaN → Inconclusive → eventually aborts after
inconclusiveLimit: 3(~15 minutes). What actually happens: empty result vector →result[0]panic →Error(notInconclusive) → 10s retry cadence (not 1m) →consecutiveErrorLimit: 4exceeded in ~50 seconds, not 5+ minutes. Anyone driving synthetic traffic from Terminal #3 has under a minute to start producing requests after promote.The PreSync hook tax is significant. 4 minutes per canary if the migration Job lands on raspi-1 (arm64 cold pull of a 714 MB image). Round-trip PR 1.5 + PR 1.6 became ~8 min of pre-canary wait that has nothing to do with the canary. Future improvement:
nodeSelector: kubernetes.io/arch=amd64on the migration Job.The replica-count canary distributes traffic cleanly at the kube-proxy layer. Per-stable-pod request count over the canary window:
Pod Node Requests litellm-79db46b9fc-4t757mini-1 152 litellm-79db46b9fc-9r6c5mini-2 142 litellm-79db46b9fc-dnmn6pc-1 127 litellm-79db46b9fc-wtjvxmini-3 139 Mean 140, σ ≈ 9.4, σ/μ ≈ 6.7% — textbook uniform distribution from a 4-endpoint Service over independent connections. No source-IP affinity bias, no node-locality bias, no Cilium cluster-mesh skew. By symmetry the canary endpoint received its proportional ~20% share. This is the data-plane proof that the replica-count canary works as designed; we were not relying on faith.
Also caught Bug #2 (the over-broad canary Service selector) on a pre-merge code-review pass of PR #213.
Terminal #3 (the synthetic-traffic driver) ran a 1 req/sec curl loop against the LB and watched for non-200s. Caught Bug #4 (the 5xx-only query) by observing 0 success / 114 requests on
mistral-small— all 404 + 429 from OpenRouter’s:free-tier upstream which had silently broken — and correctly extrapolated that “if a real canary were in flight, my loop would have green-lit a deployment while the user-facing model was completely broken.” That is the worst possible failure mode of progressive delivery: silent confidence in a deployment that is completely broken to users. Also sketched the 50-line Python sidecar exporter shown above as the most attractive Path B option, and flagged a forward-looking concern: single-model probing has a blind spot. A traffic loop hitting only one alias can mask a per-route degradation in another. The 2026-05-04 rehearsal hitmistral-smallfirst and found the OpenRouter:freeupstream broken — easy to spot at 0/114 success; if the loop had been onqwen3.5(all-200) and onlymistral-smallwere broken, the canary’s traffic snapshot would have been deceptively green. For higher-confidence rehearsals: rotate through several model classes (default chat, multimodal, coding, reasoning), and accept the ~5 req/sec aggregate load. Captured in the Path B spec as an adjacent improvement.
The conversation lived in three append-only files. Each agent posted their observations, then read the other two, then posted corrections and amplifications. Terminal #2 caught and corrected my premature “canary fired” call (the operator and I had agreed on a “Go” signal that arrived before the cluster state actually showed Paused — Terminal #2 read the cluster directly and pointed out the contradiction within a minute). Terminal #3 caught and corrected my framing of Bug #4 (“PR #216’s query causes the empty vector when canary is healthy”) to the deeper “the metric source itself doesn’t exist” version.
What worked about the pattern:
- Append-only channel, all agents read all files. No threading, no notification logic, no ordering races. Each agent reads when they have something to add. Conflicts surface as adjacent entries the operator can adjudicate.
- Distinct roles with overlapping observation surface. Terminal #2 and Terminal #3 were both watching “is the canary working” but from different angles (data-plane state vs request-shape signals). Their independent confirmation of failure modes was strong evidence; their independent disagreement about cause surfaced subtleties (e.g., Terminal #3’s “PR #216 caused empty vector” vs my “metric was never there” — both valid framings of overlapping facts).
- Operator clarification arrived directly in the channel. When the operator owned the premature-Go misattribution (“the premature first ‘Go’ was from me, the operator, not T1”), it landed as a discussion entry, not a back-channel correction. The historical record carries the clarification in the same place future readers will look for the discussion.
What I’d do differently next time:
- Start with the channel set up before the rehearsal begins, not partway through. The first 20 minutes were lost to channel-less coordination.
- Pre-assign distinct observation duties, not just “watch the rollout.” Terminal #2 and Terminal #3 each independently figured out their lane; would have been faster with a brief at the start.
- Capture the channel as a permanent artifact. The discussion files for this cascade are committed at
docs/agentic-discussion/2026-05-04--litellm-canary/. The timestamped+themed naming means future rehearsals get their own subdir, the records don’t collide, and a future contributor browsingdocs/agentic-discussion/sees a chronological list of past cascades to learn from.
Combined with the 5-bug discovery, this is the strongest evidence I have that multi-agent collaboration is materially sharper than serialised back-and-forth for live operational work. Especially work where the failure modes hide in cross-references between layers (controller logs ↔ pod state ↔ request shape) that no single observer is positioned to see all of.