
Operating on Observability
Last updated 2026-07-15 ·a77bf48
This is the operational companion to Building Observability. That post covers the architecture decisions and deployment gotchas. This one covers what you actually type when a dashboard is empty, an alert didn’t fire, or logs are missing — and the failure patterns that have bitten us more than once.
Before any of the commands below, source the environment:
source .env          # sets KUBECONFIG, TALOSCONFIG
source .env_devops   # sets OMNICONFIG + service accounts
What Healthy Looks Like
Frank’s observability stack has four moving parts:
- VictoriaMetrics (VMSingle + vmagent) — time-series metrics database and scraping engine (
monitoringnamespace, 20Gi Longhorn PersistentVolumeClaimA Kubernetes request for durable storage. The pod names a claim and the storage layer — Longhorn on Frank — binds real disk behind it, so the data outlives the pod., 1-month retention) - Grafana at
http://192.168.55.203— dashboards and exploration, OpenID ConnectAn identity layer on top of OAuth 2.0: it adds a token saying *who* the user is, not merely what the client may do. Frank's single sign-on speaks it, with Authentik as the provider. auth via Authentik - Fluent Bit — DaemonSet on all 7 nodes (including tainted control-plane and GPU nodes), shipping container logs
- VictoriaLogs — log storage with 30-day retention, queryable through Grafana’s Explore tab
Supporting collectors: node-exporter (hardware metrics on all nodes), kube-state-metrics (Kubernetes object metrics), blackbox-exporter (endpoint probes for alerting).
All four pieces running means the stack is healthy:
kubectl get pods -n monitoring | head -20Expected output shows Running for vmsingle, victoria-logs, grafana, vmagent, fluent-bit, node-exporter, and kube-state-metrics pods.
    graph LR
  subgraph COLL["Collectors (7 nodes)"]
    FB["Fluent Bit<br/>DaemonSet"]
    NE["node-exporter<br/>DaemonSet"]
    KSM["kube-state-metrics"]
    BB["blackbox-exporter"]
  end
  subgraph STORE["Storage Layer"]
    VM["VictoriaMetrics<br/>VMSingle"]
    VL["VictoriaLogs"]
  end
  subgraph UI["Visualization"]
    GF["Grafana<br/>192.168.55.203"]
  end
  FB -->|"logs"| VL
  NE -->|"metrics"| VM
  KSM -->|"metrics"| VM
  BB -->|"probes"| VM
  VM --> GF
  VL --> GF
Verify
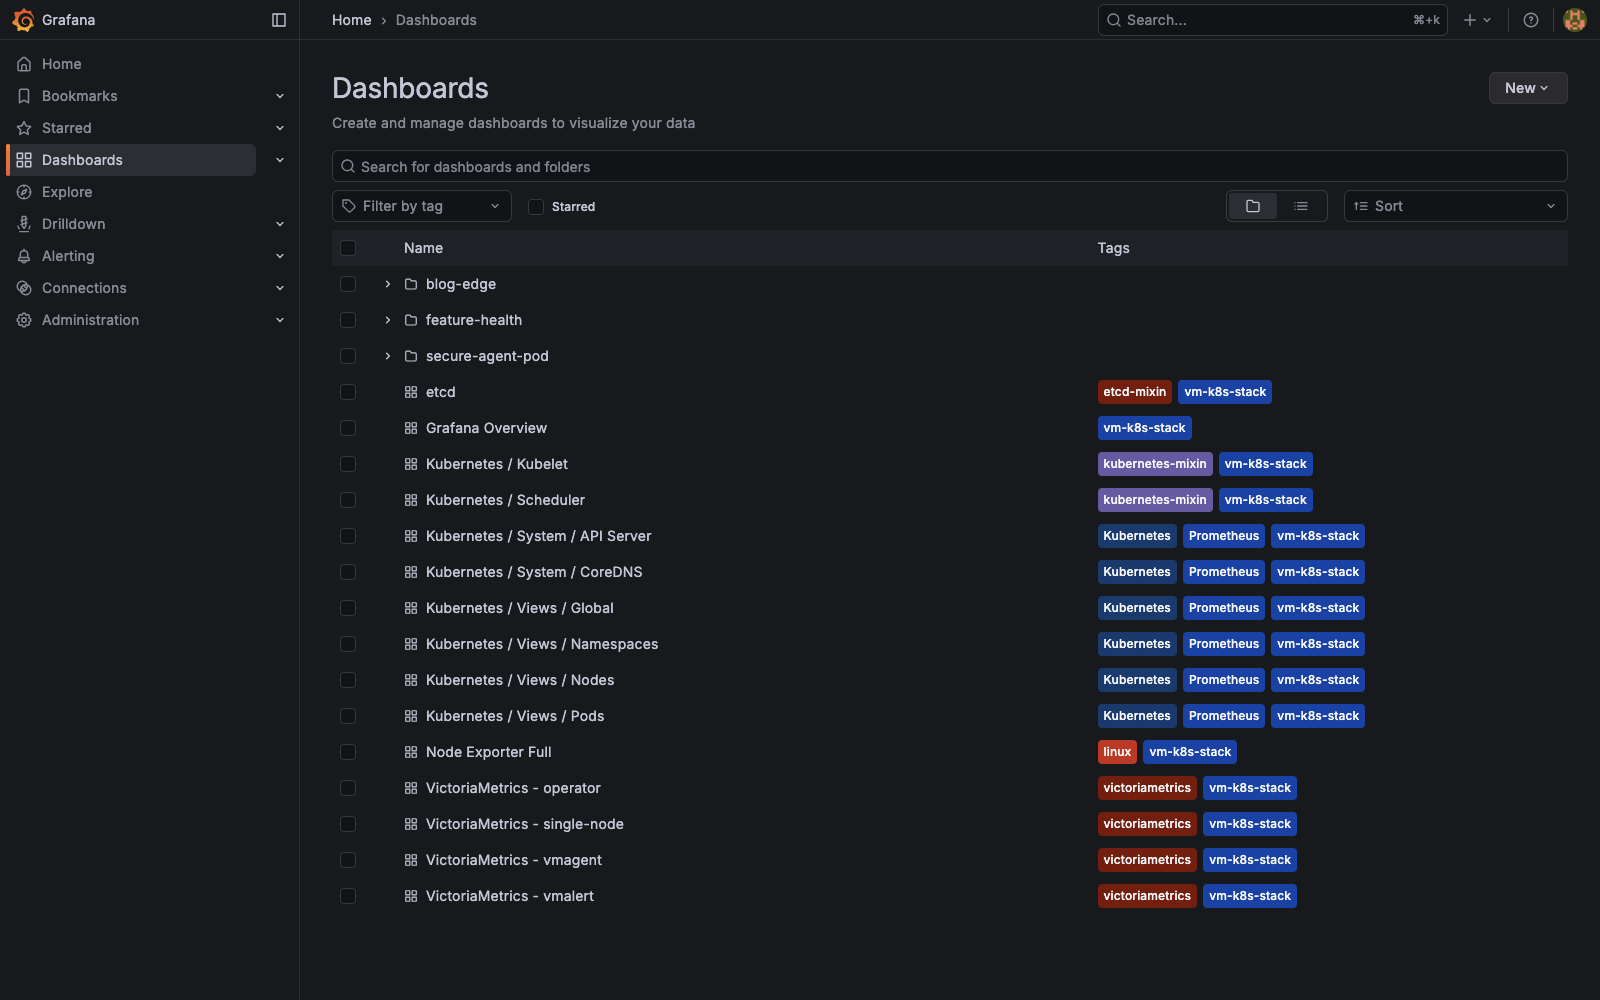
Grafana Dashboards
Open http://192.168.55.203 in a browser. The stack ships with pre-built dashboards under the “VictoriaMetrics” folder:
- Node Exporter Full — per-node CPU, memory, disk I/O, network, filesystem
- Kubernetes / Compute Resources / Cluster — cluster-wide CPU and memory requests vs limits vs actual usage
- Kubernetes / Compute Resources / Namespace — the same, broken down by namespace
- VMAgent — scrape targets, samples/sec, queue depth
These dashboards are provisioned by the Helm chart and survive Grafana pod restarts because Grafana’s 1Gi Longhorn PVC preserves them.
Querying Metrics with MetricsQL
Port-forward to VMSingle and use its built-in UI:
kubectl port-forward -n monitoring svc/vmsingle-victoria-metrics-victoria-metrics-k8s-stack 8429:8429Then open http://localhost:8429/vmui in your browser. MetricsQL is a superset of PromQL — any PromQL query works, plus extensions like keep_metric_names and range_median.
Starter queries:
# CPU usage by node (1m average)
100 - (avg by(instance) (rate(node_cpu_seconds_total{mode="idle"}[1m])) * 100)

# Memory usage percentage by node
(1 - node_memory_MemAvailable_bytes / node_memory_MemTotal_bytes) * 100

# Pod restart counts in the last hour
increase(kube_pod_container_status_restarts_total[1h]) > 0

# Disk usage on Longhorn volumes
kubelet_volume_stats_used_bytes / kubelet_volume_stats_capacity_bytes * 100
From the CLI:
kubectl port-forward -n monitoring svc/vmsingle-victoria-metrics-victoria-metrics-k8s-stack 8429:8429 &
curl -s 'http://localhost:8429/api/v1/query?query=up' | jq '.data.result[] | {instance: .metric.instance, up: .value[1]}'
Querying Logs with VictoriaLogs
Logs are queryable through Grafana’s Explore tab — select the “VictoriaLogs” datasource and use LogsQL:
# All logs from ArgoCD
{kubernetes_namespace_name="argocd"}

# Logs from VictoriaMetrics pods
{kubernetes_pod_name=~"victoria-metrics.*"}

# Error lines across the entire cluster
{kubernetes_namespace_name=~".+"} |= "error"

# Logs from the GPU node
{kubernetes_host="gpu-1"} | level:error
For CLI access, port-forward to VictoriaLogs:
kubectl port-forward -n monitoring svc/victoria-logs-victoria-logs-single-server 9428:9428
curl -s 'http://localhost:9428/select/logsql/query?query={kubernetes_namespace_name="monitoring"}&limit=10' | jq .
Checking Pipeline Health
# vmagent is scraping
kubectl get pods -n monitoring -l app.kubernetes.io/name=vmagent
kubectl logs -n monitoring -l app.kubernetes.io/name=vmagent --tail=5

# Fluent Bit is running on all nodes
kubectl get ds -n monitoring fluent-bit
# DESIRED and READY should match (7 nodes)

# VictoriaLogs is accepting writes
kubectl logs -n monitoring -l app=victoria-logs-single-server --tail=5
Steps
Creating and Importing Grafana Dashboards
To import a community dashboard (e.g. ID 1860 for Node Exporter Full):
- Open Grafana at
http://192.168.55.203 - Go to Dashboards > Import
- Enter the dashboard ID and click Load
- Select the VictoriaMetrics datasource and click Import
Imported dashboards are saved to the 1Gi Longhorn PVC and survive pod restarts. One gotcha: because that PVC is ReadWriteOnce, we pinned Grafana’s deployment strategy to Recreate (commit e40c952d). A RollingUpdate with a ReadWriteOnceA PVC access mode that lets exactly one node mount the volume read-write at a time. It is the reason a RollingUpdate deadlocks: the replacement pod cannot mount the volume until the outgoing pod releases it. volume means the new pod can’t attach the PVC on a different node until the old pod releases it — which doesn’t happen cleanly, so the rollout stalls for ~2 hours.
Adjusting Retention
Metrics retention (1 month) is set in apps/victoria-metrics/values.yaml:
vmsingle:
  spec:
    retentionPeriod: "1"
Log retention (30 days) is in apps/victoria-logs/values.yaml:
server:
  retentionPeriod: 30d
We bumped logs from 14d to 30d alongside the cross-cluster shipping fix in d8de469c. Change the value, commit, and let ArgoCD sync. Existing data outside the new window is garbage-collected on the next retention pass.
Checking What vmagent Is Scraping
kubectl port-forward -n monitoring svc/vmagent-victoria-metrics-victoria-metrics-k8s-stack 8429:8429Open http://localhost:8429/targets to see every scrape target, its status (up/down), last scrape time, and error messages. This is the first place to look when a metric is missing.
Exploring Available Metrics
# List all metric names
curl -s 'http://localhost:8429/api/v1/label/__name__/values' | jq '.data[:20]'

# Search for metrics by keyword
curl -s 'http://localhost:8429/api/v1/label/__name__/values' | jq '.data[] | select(test("gpu|nvidia"))'
Recover
Missing Metrics — the cardinality labeldrop
If a metric you expect is missing from VMSingle but the exporter is running, the most likely cause is high-cardinality labels hitting the series limit. VictoriaMetrics’ default -maxLabelsPerTimeseries=40 silently drops series that exceed it.
We hit this in May 2026 (commit 193c3890). The amd64 nodes’ node-exporter metrics carried 60–135 labels each — Node Feature DiscoveryThe component that inspects each node and labels it with what it has — CPU features, kernel modules, PCI devices — so workloads can select hardware by capability instead of by hostname. CPU feature labels (feature_node_kubernetes_io_*), Talos extension labels (extensions_talos_dev_*), NVIDIA driver labels (nvidia_com_*). The raspi nodes had ~33 labels and passed; the 5 amd64 nodes were silently dropped. VMSingle logged ignoring series with N labels... but no alert fired.
The fix was to drop those high-cardinality label groups in apps/victoria-metrics/values.yaml:
kubelet:
  metricRelabelConfigs:
  - action: labeldrop
    regex: ^(uid|id)$
  - action: labeldrop
    regex: ^(name)$
  - action: labeldrop
    regex: ^(feature_node_kubernetes_io_.*|extensions_talos_dev_.*|nvidia_com_.*|beta_kubernetes_io_.*)$
  - action: drop
    regex: rest_client_request_duration_seconds_(bucket|sum|count)
The key choice: we dropped the labels rather than bumping -maxLabelsPerTimeseries. Bumping the limit would absorb the bloat temporarily but push the cardinality bomb downstream — the series count would keep growing until it hit storage or query limits. Dropping the labels at scrape time is the correct fix.
In general, when a metric is missing:
Check the exporter pod is running:
kubectl get pods -n monitoring -l app.kubernetes.io/name=node-exporter
kubectl get pods -n monitoring -l app.kubernetes.io/name=kube-state-metrics
Check vmagent targets at
http://localhost:8429/targets— is it scraping the endpoint?Check the VMServiceMonitor exists and matches labels:
kubectl get vmservicemonitors -n monitoring
kubectl describe vmservicemonitor <name> -n monitoring
Check the exporter directly:
kubectl port-forward -n monitoring <exporter-pod> <port>:<port>
curl http://localhost:<port>/metrics | grep <metric-name>
Fluent Bit Not Shipping Logs
If logs are not appearing in VictoriaLogs:
Check Fluent Bit pods are running on all nodes:
kubectl get ds -n monitoring fluent-bit
kubectl get pods -n monitoring -l app.kubernetes.io/name=fluent-bit -o wide
Check Fluent Bit logs for output errors:
kubectl logs -n monitoring -l app.kubernetes.io/name=fluent-bit --tail=50Look for
retrylines. Silent retries with no error detail usually mean DNS resolution failure — the output hostname is wrong or the target service is down.Verify the destination hostname resolves:
kubectl exec -n monitoring <fluent-bit-pod> -- nslookup \
  victoria-logs-victoria-logs-single-server.monitoring.svc.cluster.local
Check tail file positions — Fluent Bit tracks where it left off. Stale positions mean it may be re-reading or skipping:
kubectl exec -n monitoring <fluent-bit-pod> -- ls -la /var/log/flb_kube.db
Grafana Rollout Stuck
If you’re changing Grafana config and the rollout hangs:
kubectl rollout status -n monitoring deployment grafanaIf it stalls for more than a few minutes, check whether the strategy is Recreate — it should be (commit e40c952d). If it’s RollingUpdate, the RWO Longhorn PVC will block the new pod from starting until the old pod terminates, and Kubernetes won’t terminate the old pod until the new one starts. Either change the strategy back to Recreate or scale the old replica to zero:
kubectl scale deployment -n monitoring grafana --replicas=0
# wait, then
kubectl scale deployment -n monitoring grafana --replicas=1
Alert Didn’t Fire — Telegram formatting failures
If an alert rule fires but nobody gets notified, check the contact point. We’ve had three distinct Telegram delivery failures:
Markdown parsed
_as italic —job=session_managerrendered assessionmanager, so incident triage was routed to the wrong handler. Fixed by removingparse_mode: Markdownfrom the Telegram contact point (commitcc239cf9).HTML annotation values rejected — annotation values contained
<node-ip>and>6. Telegram’s HTML parser rejected<node-ip>as an invalid HTML tag. The message dispatched but Telegram returned HTTP 400 — silently (commitc866a85e). Fixed by stripping<>&from annotations.Trailing newline in bot token — the Telegram bot token from Infisical had a trailing newline, causing HTTP 404 on
sendMessage— also silent (commitf7d8f189). Fixed by defensive credential stripping at the secret level.
If you suspect a silent delivery failure, check the Grafana Alerting log:
kubectl logs -n monitoring deployment/grafana --tail=100 | grep -i "telegram\|failed\|error\|400\|404"The Watcher Also Goes Silent — Credential Expiry
The Telegram bot for the persistent agent (alert-agent) authenticates with a
Claude OAuth token that expires on a hard ~30-day clock. In July 2026 it expired
unnoticed: the pod stayed 3/3 Running, ArgoCD stayed green, and the failure
(Login expired · Please run /login) lived inside a tmux pane — invisible to
every probe. The bot was dead for three days before anyone noticed.
The fix is a daily in-container check (cred-expiry-check, 09:00) that reads the
token’s refreshTokenExpiresAt and:
- warns Telegram when ≤7 / ≤3 / ≤1 days remain (wording sharpens as it nears), so a re-login is a scheduled chore, not a scramble;
- emits a heartbeat line (
cred-expiry-check days_left=N tier=…) that a Grafana dead-man rule (alert-agent-cred-expiry-heartbeat-stale) watches — if the check itself stops, that rule pages directly.
Day-to-day: you’ll get a Telegram nudge roughly monthly; re-login by attaching the
agent’s tmux and running /login (runbook: obs-alert-agent-claude-login). To
see the heartbeat:
# the last heartbeat line
kubectl exec -n alert-agent deploy/alert-agent -c agent -- \
  /opt/alert-agent-bin/cred-expiry-check
One trap worth recording: Frank’s VictoriaLogs carries the message in the _msg
field, but Hop’s fluent-bit uses log — so the dead-man rule’s LogsQL had to use
_msg:"cred-expiry-check"; the Hop CrowdSec canary’s log:"…" form returns 0 on
Frank and would have left the watchdog permanently blind. Same lesson as the
silent Telegram failures above: a monitor that Synced is not a monitor that
fires — you have to observe it end to end.
False Positives from Completed Pods
Some layer alerts fire for namespaces that run Tekton pipelines, Argo Workflows, or other Jobs/CronJobs. kube_pod_status_ready{condition="true"} reports 0 for pods in Completed or Error state — those are by-design not-Ready post-completion.
If a namespace with active CI accumulates such pods, a reduce.last on the per-pod series can pick one and trip the threshold. The fix (commit 8068eedd) was to exclude completed pods from the layer-8 observability alert:
kube_pod_status_ready{namespace="monitoring"}
  unless on(namespace,pod)
    kube_pod_status_phase{phase=~"Succeeded|Failed"} == 1
For layer alerts on CI namespaces, switch to Deployment-based queries:
kube_deployment_status_replicas_unavailable{namespace=~"tekton|workflows|…"}Deployments are long-running; Job pods aren’t owned by Deployments, so they’re excluded naturally.
High Cardinality
If VMSingle memory usage is climbing or queries are slow, high cardinality labels are the usual cause:
# Check top series by cardinality
curl -s 'http://localhost:8429/api/v1/status/tsdb' | jq '.data.seriesCountByMetricName[:10]'
If a metric has an unbounded label (request ID, session token), either drop the label in vmagent’s relabeling config or exclude the metric entirely.
VictoriaLogs Query Returns No Results
Check VictoriaLogs is receiving data:
kubectl port-forward -n monitoring svc/victoria-logs-victoria-logs-single-server 9428:9428
curl -s 'http://localhost:9428/select/logsql/query?query=*&limit=5' | jq .
If results come back, the problem is your query syntax, not the pipeline.
Check the Grafana datasource — the VictoriaLogs datasource must point to
http://victoria-logs-victoria-logs-single-server.monitoring.svc.cluster.local:9428. Go to Grafana > Configuration > Data Sources and verify. If thequeryTypeis not set tostats, queries against long series will fail with a DatasourceError (commita6651c4f— the fix was settingqueryType: statsto hit/select/logsql/stats_queryinstead of/select/logsql/query).Check retention — if logs are older than 30 days, they have been garbage-collected.
Missteps
| What we assumed | Why it was wrong | What it cost |
|---|---|---|
| The default Helm scrape configs would capture all node metrics without issue | amd64 nodes carry 60-135 labels/series from NFD CPU features, Talos extensions, and NVIDIA driver labels — exceeding VictoriaMetrics’ default -maxLabelsPerTimeseries=40. The raspi nodes (33 labels) passed silently, masking the failure. | 5/7 nodes’ cadvisor data was silently dropped for weeks. No alert fired. Discovered during a routine dashboard review. |
RollingUpdate is the safe default for Grafana, even with a RWO PVC | A new Grafana pod on a different node can’t attach the Longhorn PVC until the old pod releases it — but K8s won’t terminate the old pod until the new one is healthy. The rollout deadlocks for ~2 hours. | ~2h deployment stalls on every config change until someone force-scales. |
| A Network Interface CardThe network adapter itself. Worth naming precisely on Frank, where one flapping onboard NIC took down every pod on a node at once. is either up or down — binary link-state monitoring is sufficient | Flapping NICs that go up-down-up within 5m are invisible to binary-down-state rules with for: 5m. On June 8 2026, gpu-1’s enp3s0 flapped 76 times over ~8 hours — 0 alerts fired. | An 8-hour networking blind spot on the GPU node during active inference workloads. |
| Telegram contact point annotations are opaque strings — any format works | Telegram’s HTML parser rejects <node-ip> as an invalid HTML tag, returning HTTP 400 — which Grafana logs as “sent” with no error. Similarly, Markdown parse_mode silently strips underscores in label values. | Alert state changed to Firing in Grafana, the Telegram message dispatched, but the operator never saw it. Silent delivery failures are worse than no alert — they create a false sense of coverage. |
Quick Reference
| Command | What It Does |
|---|---|
kubectl port-forward -n monitoring svc/vmsingle-... 8429:8429 | Access VMSingle UI and API |
kubectl port-forward -n monitoring svc/victoria-logs-...-server 9428:9428 | Access VictoriaLogs API |
kubectl get ds -n monitoring fluent-bit | Check Fluent Bit DaemonSet status |
kubectl logs -n monitoring -l app.kubernetes.io/name=fluent-bit --tail=50 | Fluent Bit output logs |
kubectl logs -n monitoring -l app.kubernetes.io/name=vmagent --tail=50 | vmagent scrape logs |
kubectl get vmservicemonitors -n monitoring | List all metric scrape configs |
curl localhost:8429/api/v1/query?query=up | Query metrics via API |
curl localhost:9428/select/logsql/query?query=*&limit=10 | Query logs via API |
curl localhost:8429/targets | List vmagent scrape targets |
curl localhost:8429/api/v1/status/tsdb | Time Series DatabaseA database built for timestamped numeric series. VictoriaMetrics is Frank's; the shape of the data is why it compresses so much better than a general-purpose store. cardinality stats |
References
- VictoriaMetrics Documentation — MetricsQL reference, VMSingle operations, retention
- VictoriaLogs Documentation — LogsQL syntax, ingestion API
- Grafana Documentation — Dashboard management, datasource provisioning
- Fluent Bit Documentation — Pipeline debugging, tail input, HTTP output
- Building Observability — Architecture decisions and deployment gotchas