

Operating on Health Monitoring
Last updated 2026-07-15 ·a77bf48
This is the operational companion to Health Monitoring. That post covers the architecture behind feature probes, heartbeats, and alerting. This one covers what you type when a probe shows down, a heartbeat went stale, or an alert fired but nobody got the Telegram notification — including the delivery failures we discovered the hard way.
Before any commands below, source the environment:
source .env          # sets KUBECONFIG, TALOSCONFIG
source .env_devops   # sets OMNICONFIG + service accounts
Data Flow
    flowchart TD
    subgraph "Probes & Heartbeats"
        A["Blackbox Exporter<br/>HTTP probes"] --> P[(VictoriaMetrics)]
        B["Cron scripts<br/>Pushgateway"] --> P
    end
    P --> C[Grafana alert rules]
    C --> D{"Condition met?"}
    D -->|Yes, firing| E[Notification policy]
    D -->|No, resolved| F[Update Lifecycle only]
    E --> G{Severity}
    G -->|critical| H[Telegram + Health Bridge]
    G -->|warning| I[Health Bridge only]
    H --> J[Derio Ops board + Issue]
    I --> J
Feature probes and cron heartbeats feed into VictoriaMetrics. Grafana alert rules evaluate conditions; when a threshold is breached, the notification policy routes by severity — critical alerts go to Telegram + Health Bridge, warnings to the Health Bridge alone. The bridge updates the Derio Ops board’s Lifecycle field and opens/closes bug issues.
What Healthy Looks Like
All feature health probes show probe_success=1, all cron heartbeats push within their expected cadences, and Grafana alert rules fire and notify through Telegram without silent delivery failures. The Feature Health dashboard at /d/fh-overview/feature-health shows every probe UP and every heartbeat recent.
Verify
Checking Probe Status
# Port-forward to Blackbox Exporter
kubectl port-forward -n monitoring svc/blackbox-exporter 9115:9115 &

# Probe a specific endpoint
curl -s "http://localhost:9115/probe?target=https://grafana.frank.derio.net&module=http_2xx" | grep probe_success
# Expected: probe_success 1

# Check all feature health probes via VictoriaMetrics
GRAFANA_AUTH="admin:$(kubectl get secret -n monitoring victoria-metrics-grafana -o jsonpath='{.data.admin-password}' | base64 -d)"
curl -sk -u "$GRAFANA_AUTH" "https://grafana.frank.derio.net/api/datasources/proxy/uid/P4169E866C3094E38/api/v1/query" \
  --data-urlencode 'query=probe_success{probe_group="feature_health"}'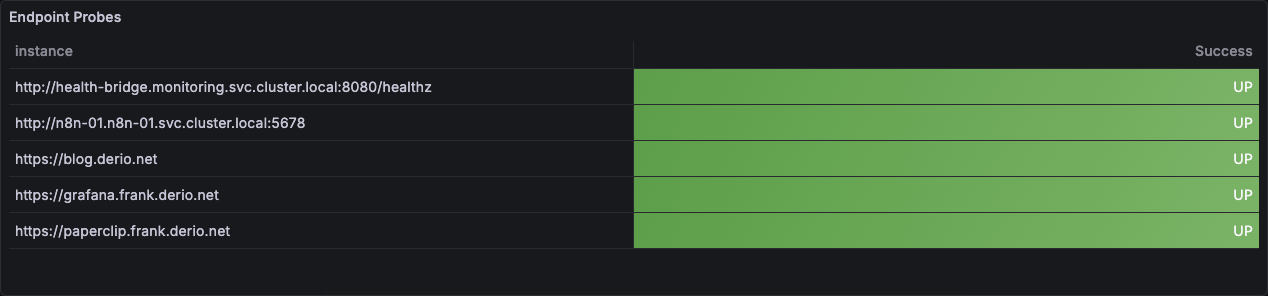
Checking Heartbeat Metrics
# Port-forward to Pushgateway
kubectl port-forward -n monitoring svc/pushgateway 9091:9091 &

# View all heartbeat metrics
curl -s http://localhost:9091/metrics | grep willikins_heartbeat

# Push a test heartbeat
echo "willikins_heartbeat_last_success_timestamp $(date +%s)" | \
  curl -s --data-binary @- http://localhost:9091/metrics/job/test_job

# Delete a test metric
curl -s -X DELETE http://localhost:9091/metrics/job/test_job
Listing Active Alert Rules
All Grafana alerting is file-provisioned via ConfigMaps:
GRAFANA_AUTH="admin:$(kubectl get secret -n monitoring victoria-metrics-grafana -o jsonpath='{.data.admin-password}' | base64 -d)"

# List all alert states
curl -sk -u "$GRAFANA_AUTH" \
  "https://grafana.frank.derio.net/api/prometheus/grafana/api/v1/alerts" | \
  python3 -c "import json,sys; [print(f'{a[\"state\"]}: {a[\"labels\"][\"alertname\"]}') for a in json.load(sys.stdin)['data']['alerts']]"
Steps
Editing Alert Rules
File-provisioned rules are read-only in the UI. To modify:
- Edit the ConfigMap YAML in
apps/grafana-alerting/manifests/alert-rules-cm.yaml - Commit and push — ArgoCD syncs the ConfigMap
- Restart Grafana to reload provisioning files:
kubectl delete pod -n monitoring -l app.kubernetes.io/name=grafana - Verify the rule loaded without errors:
kubectl logs -n monitoring -l app.kubernetes.io/name=grafana --tail=200 | grep -iE 'parseError|provisioning.*error'
Editing the Feature Health Dashboard
- Open the provisioned dashboard in Grafana UI, click “Save as” to create a scratch copy
- Edit freely in the UI
- Export the final JSON (Share → Export → Save to file)
- Replace the JSON content in
apps/grafana-alerting/manifests/dashboard-cm.yaml - Commit, push, restart Grafana pod
- Delete the scratch dashboard
Pushing a Manual Heartbeat
kubectl exec -n secure-agent-pod deploy/secure-agent-pod -c kali -- /opt/scripts/push-heartbeat.sh <job_name> [label=value ...]
# Example: kubectl exec ... /opt/scripts/push-heartbeat.sh exercise_reminder context=desk
Recover
Telegram Notification Not Arriving
If an alert fires but no Telegram message arrives, check three failure patterns we’ve fixed:
Markdown stripping underscores —
parse_mode: Markdowninterprets_as italic.job=session_managerrenders assessionmanager(commitcc239cf9). Fixed by removingparse_mode.HTML annotation rejection — annotation values like
<node-ip>are valid strings but Telegram’s HTML parser rejects them as invalid HTML tags. The message dispatches but Telegram returns HTTP 400 silently (commitc866a85e). Fixed by stripping<>&from annotations.Trailing newline in bot token — the Telegram bot token from Infisical had a trailing newline, causing HTTP 404 on
sendMessage— also silent (commitf7d8f189). Fixed by defensive credential stripping.
Check Grafana logs for any of these:
kubectl logs -n monitoring -l app.kubernetes.io/name=grafana -c grafana --tail=50 | grep -iE "error|warn|notify|telegram|400|404"If the contact point is misconfigured, restart Grafana to reset the notification dedup state:
kubectl delete pod -n monitoring -l app.kubernetes.io/name=grafanaVMProbe/VMServiceScrape Not Applying
If kubectl apply fails with x509: certificate signed by unknown authority:
# The VictoriaMetrics Operator webhook caBundle is out of sync
kubectl get validatingwebhookconfiguration -l app.kubernetes.io/instance=victoria-metrics -o yaml | grep caBundle | head -1

# Fix: restart the operator to regenerate certs
kubectl rollout restart deployment -n monitoring victoria-metrics-operator
Dashboard Shows No Data
- Verify datasource User IdentifierThe number Linux actually checks for file permissions — the name is a lookup. In containers a uid mismatch against a mounted volume is the usual cause of a permission error. is
P4169E866C3094E38 - Table panels require
"format": "table"on targets ALERTS{}metric doesn’t exist for Grafana-managed alerts — usealertlistpanel type
Missteps
| What we assumed | Why it was wrong | What it cost |
|---|---|---|
| Telegram contact point annotations are opaque strings — any format works | Telegram’s HTML parser rejects <node-ip> as an invalid HTML tag. parse_mode: Markdown silently strips underscores in label values like session_manager. Both return HTTP 400/200 with no Grafana error. | Silent delivery failures on active alerts. An alert shows Firing in Grafana, the message appears sent, but no operator ever sees it. |
| A Network Interface CardThe network adapter itself. Worth naming precisely on Frank, where one flapping onboard NIC took down every pod on a node at once. is either up or down — binary link-state monitoring is sufficient | Flapping NICs that go up-down-up within 5m are invisible to binary-down-state rules with for: 5m. gpu-1’s enp3s0 flapped 76 times over ~8h — 0 alerts fired (commit 9ee2cde1). | An 8-hour networking blind spot on the GPU node during active inference workloads. |
| The Grafana alerting ConfigMap alone controls what fires — provisioning files are watched at boot | Grafana reads provisioning files at startup. After editing the ConfigMap, the new rules don’t take effect until Grafana restarts. | Multiple incidents where a rule change was committed and synced but alerts continued from the old rules. |
Quick Reference
| Component | Namespace | Port | Purpose |
|---|---|---|---|
| Blackbox Exporter | monitoring | 9115 | HTTP endpoint probing |
| Pushgateway | monitoring | 9091 | Heartbeat metric ingestion |
| Grafana | monitoring | 3000 (Load BalancerWhatever spreads traffic across backends and gives them one address. On Frank that is Cilium answering for an address on the LAN, not a cloud appliance.: 192.168.55.203) | Dashboards + alerting |
| Feature Health Dashboard | — | — | /d/fh-overview/feature-health |