Operating on CI/CD Platform
Companion operations guide for CI/CD Platform — Gitea, Tekton, Zot, and Cosign.
Quick Health Check
# All CI/CD pods
kubectl get pods -n gitea -o wide
kubectl get pods -n tekton-pipelines -o wide
kubectl get pods -n zot -o wide

# ArgoCD app status
kubectl get applications -n argocd gitea gitea-extras \
  tekton-pipelines tekton-triggers tekton-dashboard tekton-extras \
  zot zot-extras

# ExternalSecrets sync status
kubectl get externalsecret -n gitea
kubectl get externalsecret -n tekton-pipelines
kubectl get externalsecret -n zot
Healthy state: all pods Running on pc-1, all ArgoCD apps Synced/Healthy, all ExternalSecrets SecretSynced.
$ kubectl get pods -n gitea -o wide
NAME                     READY   STATUS    RESTARTS   AGE     IP            NODE   NOMINATED NODE   READINESS GATES
gitea-6d7d457c49-t5hsj   1/1     Running   0          7h40m   10.244.7.57   pc-1   <none>           <none>

$ kubectl get pods -n tekton-pipelines -o wide
NAME                                                 READY   STATUS    RESTARTS        AGE     IP              NODE     NOMINATED NODE   READINESS GATES
el-gitea-listener-7d85fd8b75-8w9z6                   1/1     Running   3 (7h41m ago)   7d7h    10.244.7.226    pc-1     <none>           <none>
tekton-dashboard-774bff7cc-92cmn                     1/1     Running   0               22d     10.244.8.175    mini-3   <none>           <none>
tekton-events-controller-5cbc777ccd-7gvq7            1/1     Running   0               22d     10.244.8.144    mini-3   <none>           <none>
tekton-pipelines-controller-7496c46798-kgphw         1/1     Running   0               7d10h   10.244.12.233   mini-1   <none>           <none>
tekton-pipelines-webhook-75cd84877-tgctj             1/1     Running   0               22d     10.244.12.139   mini-1   <none>           <none>
tekton-triggers-controller-66fd74568d-m8zsv          1/1     Running   0               22d     10.244.8.254    mini-3   <none>           <none>
tekton-triggers-core-interceptors-66456f8cf6-blt4s   1/1     Running   0               22d     10.244.8.181    mini-3   <none>           <none>
tekton-triggers-webhook-55c8dd895f-j95ft             1/1     Running   0               22d     10.244.8.187    mini-3   <none>           <none>

$ kubectl get pods -n zot -o wide
NAME                   READY   STATUS    RESTARTS   AGE     IP             NODE   NOMINATED NODE   READINESS GATES
zot-68c79b95f9-6vbhh   1/1     Running   0          7h41m   10.244.7.202   pc-1   <none>           <none>
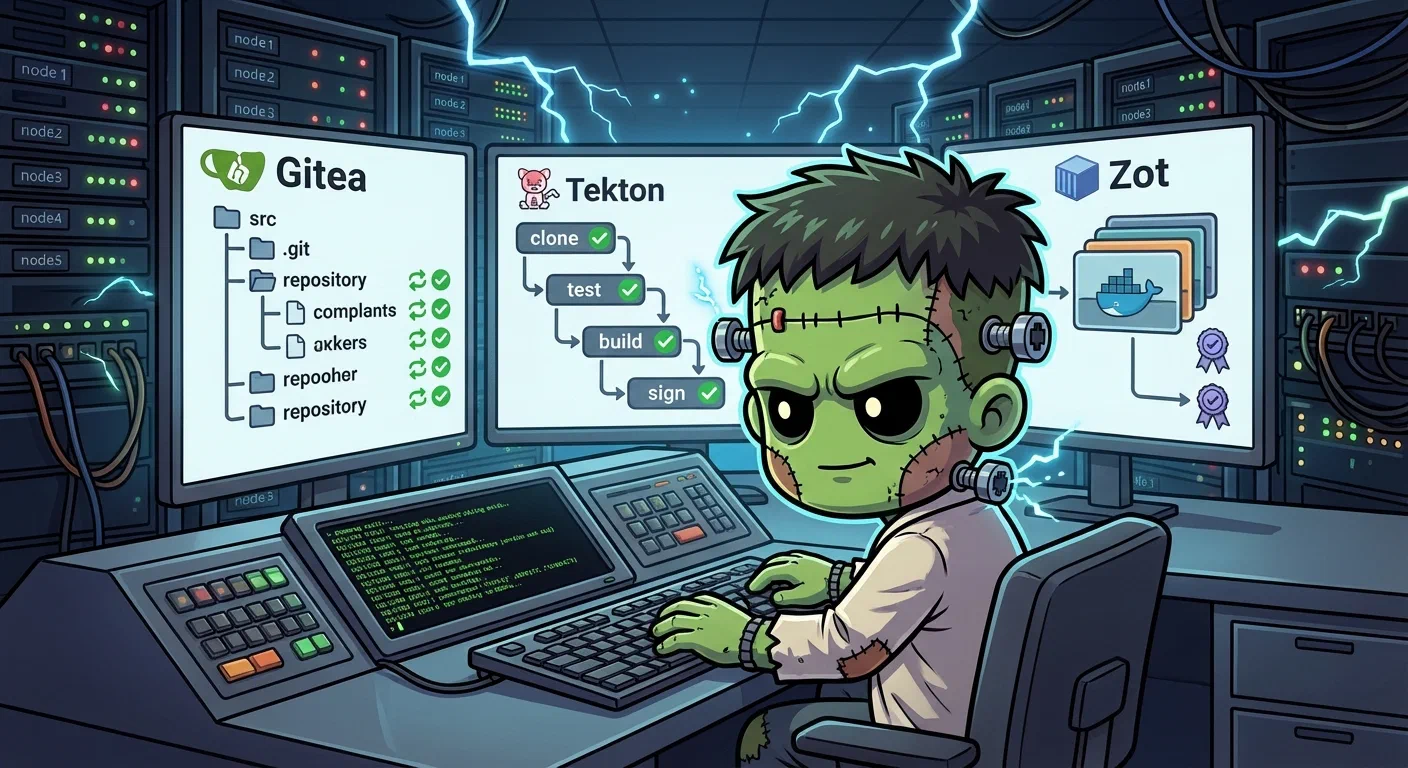
Gitea Operations
Mirror Sync Status
# Check mirror sync time via API
GITEA_URL="http://192.168.55.209:3000"
curl -s "$GITEA_URL/api/v1/repos/tekton-bot/frank" | jq '{
  mirror: .mirror,
  updated_at: .updated_at,
  mirror_interval: .mirror_interval
}'
Expected: mirror: true, updated_at within the last 10 minutes.
Force Mirror Sync
# Trigger immediate mirror sync
ADMIN_TOKEN=$(kubectl get secret -n gitea gitea-secrets -o jsonpath='{.data.admin-password}' | base64 -d)
curl -sf -X POST "$GITEA_URL/api/v1/repos/tekton-bot/frank/mirror-sync" \
  -H "Authorization: token $ADMIN_TOKEN"
Gitea Logs
kubectl logs -n gitea deploy/gitea --tail=50
kubectl logs -n gitea deploy/gitea -f  # Follow
Restart Gitea
kubectl rollout restart deploy/gitea -n gitea
kubectl rollout status deploy/gitea -n gitea
Note: Gitea uses strategy: Recreate (RWO PVC) — expect a brief downtime window during restart.
Common Gitea Issues
| Symptom | Cause | Fix |
|---|---|---|
| OIDC login fails | Authentik provider misconfigured or down | Check kubectl logs -n gitea deploy/gitea | grep oauth |
| Mirror not updating | GitHub PAT expired or rate-limited | Verify GITHUB_MIRROR_TOKEN in Infisical is valid |
| Webhook delivery fails | ALLOWED_HOST_LIST missing cluster DNS | Add *.svc.cluster.local to gitea.config.webhook.ALLOWED_HOST_LIST |
| Pod stuck in Pending | PVC can’t mount (pc-1 down) | Check kubectl get pv and node status |
Tekton Operations
List Recent PipelineRuns
# All PipelineRuns, most recent first
kubectl get pipelinerun -n tekton-pipelines --sort-by=.metadata.creationTimestamp

# Only failed runs
kubectl get pipelinerun -n tekton-pipelines \
  -o jsonpath='{range .items[?(@.status.conditions[0].status=="False")]}{.metadata.name}{"\t"}{.status.conditions[0].message}{"\n"}{end}'
View Pipeline Logs
# Latest PipelineRun logs (requires tkn CLI)
tkn pipelinerun logs -n tekton-pipelines --last

# Without tkn — find the pod and read logs per step
kubectl get pods -n tekton-pipelines -l tekton.dev/pipelineRun --sort-by=.metadata.creationTimestamp | tail -5
kubectl logs -n tekton-pipelines <pod-name> -c step-clone
kubectl logs -n tekton-pipelines <pod-name> -c step-test
kubectl logs -n tekton-pipelines <pod-name> -c step-build-and-push
kubectl logs -n tekton-pipelines <pod-name> -c step-sign
Cancel a Running PipelineRun
kubectl patch pipelinerun -n tekton-pipelines <name> \
  --type=merge -p '{"spec":{"status":"CancelledRunFinally"}}'
Clean Up Old PipelineRuns
A daily CronJob (apps/tekton/manifests/pipelinerun-ttl-gc.yaml) sweeps PipelineRuns whose status.completionTime is older than 7 days. Runs at 04:30 UTC. Inspect:
# Last GC run
kubectl get cronjob -n tekton-pipelines pipelinerun-ttl-gc
kubectl get jobs -n tekton-pipelines -l job-name | grep pipelinerun-ttl-gc | tail -3

# What it would delete now (manual dry-run via the same logic)
CUTOFF=$(date -u -d "7 days ago" +%Y-%m-%dT%H:%M:%SZ)
kubectl get pipelinerun -n tekton-pipelines \
  -o jsonpath='{range .items[?(@.status.completionTime)]}{.metadata.name}{"\t"}{.status.completionTime}{"\n"}{end}' \
  | awk -F'\t' -v c="$CUTOFF" '$2 < c {print $1}'
Force a sweep now (e.g. for a noisy cleanup before a demo):
kubectl create job -n tekton-pipelines --from=cronjob/pipelinerun-ttl-gc pipelinerun-ttl-gc-manual-$(date +%s)Why TTL matters beyond clutter: until 2026-05-14 the Layer 25 alert rule used kube_pod_status_ready{condition="true"} per-pod, which treated post-completion task pods as a degradation signal — accumulating PipelineRuns silently raised the false-positive rate. The alert query was rewritten to use kube_deployment_status_replicas_unavailable (Deployment-scoped, naturally excludes task pods), but the TTL is the proper hygiene either way.
Manual delete by criterion, when you want finer control than the CronJob:
# All failed PRs older than 1 day
kubectl get pipelinerun -n tekton-pipelines \
  -o jsonpath='{range .items[?(@.status.conditions[0].status=="False")]}{.metadata.name}{"\n"}{end}' \
  | xargs -r kubectl delete pipelinerun -n tekton-pipelines
EventListener Health
# EventListener pod logs
kubectl logs -n tekton-pipelines -l app.kubernetes.io/managed-by=EventListener --tail=30
# EventListener service reachability (from within cluster)
kubectl run test-curl --rm -it --image=curlimages/curl -- \
curl -s -o /dev/null -w "%{http_code}" \
http://el-gitea-listener.tekton-pipelines.svc.cluster.local:8080
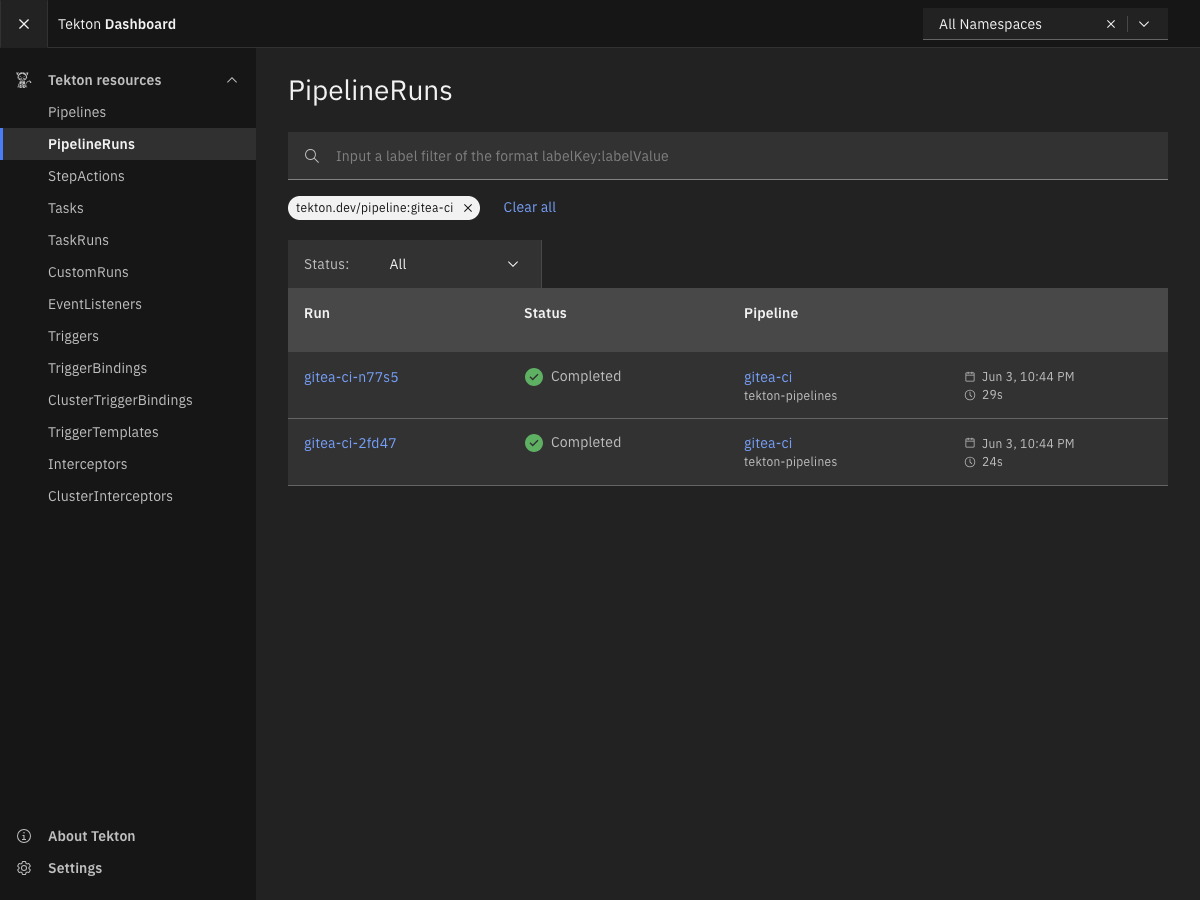
# Expect: 200 or 202Tekton Dashboard
Access at http://192.168.55.217:9097 or https://tekton.cluster.derio.net (Authentik forward-auth).
The dashboard is read-only — it shows PipelineRuns, TaskRuns, and logs. Useful for non-CLI users or quick visual debugging.
Common Tekton Issues
| Symptom | Cause | Fix |
|---|---|---|
| PipelineRun stuck in Pending | PVC can’t provision (pc-1 down or Longhorn unhealthy) | Check kubectl get pv and Longhorn UI |
ComparisonError in ArgoCD | Task YAML uses resources instead of computeResources | Fix the Task manifest and re-sync |
report-success not firing | $(tasks.status) is "Completed" not "Succeeded" | Check when clause accepts both values |
Step fails with permission denied | Missing fsGroup: 65534 on PipelineRun pod template | Add to TriggerTemplate’s taskRunTemplate.podTemplate.securityContext |
git config fails | HOME=/ is read-only for UID 65534 | Set HOME=/tekton/home env var on the step |
| PodSecurity violation | Missing securityContext on Task steps | Add runAsNonRoot, capabilities.drop, seccompProfile |
| Webhook doesn’t trigger pipeline | Gitea sends X-Gitea-Event, not X-GitHub-Event | Use CEL interceptor, not github interceptor |
Zot Registry Operations
Registry Health
# API check (anonymous read)
curl -sk https://192.168.55.210:5000/v2/
# Expect: {} or {"repositories":[]}

# List all repositories
curl -sk https://192.168.55.210:5000/v2/_catalog
# Expect: {"repositories":["test/alpine","..."]}

# List tags for a repo
curl -sk https://192.168.55.210:5000/v2/test/alpine/tags/list
Test Push
# Push a test image (requires credentials)
ZOT_PASS=$(kubectl get secret -n tekton-pipelines zot-push-creds \
  -o jsonpath='{.data.\.dockerconfigjson}' | base64 -d | jq -r '.auths["192.168.55.210:5000"].password')

# Using crane (lightweight OCI tool)
crane auth login 192.168.55.210:5000 -u tekton-push -p "$ZOT_PASS" --insecure
crane push /dev/null 192.168.55.210:5000/test/healthcheck:latest --insecure
TLS Certificate Status
# cert-manager Certificate status
kubectl get certificate -n zot zot-tls
# Expect: Ready=True

# Certificate details
kubectl describe certificate -n zot zot-tls

# Check cert expiry
kubectl get secret -n zot zot-tls -o jsonpath='{.data.tls\.crt}' | base64 -d | openssl x509 -noout -dates
Registry Logs
kubectl logs -n zot deploy/zot --tail=50Restart Zot
kubectl rollout restart deploy/zot -n zot
kubectl rollout status deploy/zot -n zot
Like Gitea, Zot uses strategy: Recreate for RWO PVC safety.
Common Zot Issues
| Symptom | Cause | Fix |
|---|---|---|
401 Unauthorized on push | Wrong password or htpasswd hash stale | Regenerate htpasswd if ZOT_PUSH_PASSWORD changed in Infisical |
x509: certificate signed by unknown authority | Self-signed cert not trusted by client | Use --insecure flag or add cert to trust store |
| Containerd pull fails on nodes | Talos mirror patch not applied | Apply patches/phase06-cicd/06-cluster-zot-registry.yaml via Omni |
| Pod stuck (PVC) | pc-1 down or Longhorn unhealthy | Check node and Longhorn status |
Cosign Operations
Verify an Image Signature
cosign verify --key apps/tekton/cosign.pub \
  --insecure-ignore-tlog --allow-insecure-registry \
  192.168.55.210:5000/<repo>/<image>:<tag>
Expected: Verification for 192.168.55.210:5000/... -- The following checks were performed: ...
Check if an Image Is Signed
# List signature artifacts for an image
crane ls 192.168.55.210:5000/<repo>/<image> --insecure
# Look for sha256-*.sig tags
Rotate Signing Keys
- Generate new key pair:
COSIGN_PASSWORD='' cosign generate-key-pair - Store new private key in Infisical as
COSIGN_KEY - Commit new
cosign.pubtoapps/tekton/cosign.pub - Wait for ExternalSecret to refresh (5 minutes) or force sync
- New images will be signed with the new key; old signatures remain valid with old public key
End-to-End Webhook Test
To verify the full pipeline chain from Gitea to signed image:
# 1. Trigger a mirror sync (or push directly to Gitea)
curl -sf -X POST "http://192.168.55.209:3000/api/v1/repos/tekton-bot/frank/mirror-sync" \
  -H "Authorization: token $ADMIN_TOKEN"

# 2. Watch for new PipelineRun
kubectl get pipelinerun -n tekton-pipelines -w

# 3. Check Gitea commit status (after pipeline completes)
curl -s "http://192.168.55.209:3000/api/v1/repos/tekton-bot/frank/statuses/<SHA>" \
  -H "Authorization: token $TOKEN" | jq '.[0].state'
# Expect: "success"
GitHub-primary Repos (agentic-stoa) Operations
The original direction (Gitea-primary, Tekton-on-Gitea-push, status-back-to-Gitea) still describes Frank’s own repo. The three repos under agentic-stoa/* (hum, content-factory, stoa-blog) run the inverted direction — see Direction Inversion in the Building post for the architecture. This section covers the day-to-day operational commands specific to that path.
The chain at a glance
GitHub webhook → Caddy on Hop (webhooks.hop.derio.net) → Tailscale mesh →
  el-github-listener (192.168.55.223:8080) → github-pull-sync → <repo>-ci → dual-status
Four moving parts whose health you may want to inspect independently: Caddy’s webhook route on Hop, the el-github-listener EventListener on Frank, the github-pull-sync Pipeline runs, and the per-repo CI Pipelines (hum-ci, content-factory-ci, stoa-blog-ci).
Inspect github-listener events
The EventListener pod logs every webhook it receives, the interceptor decision, and the resulting PipelineRun creation. Two grep patterns cover most of what you’ll want:
# Tail the github-listener pod (last 30 events)
kubectl logs -n tekton-pipelines -l eventlistener=github-listener --tail=30

# Just the trigger-firing decisions (one line per webhook)
kubectl logs -n tekton-pipelines -l eventlistener=github-listener --tail=200 \
  | grep -E "Triggered|interceptor|HMAC"
If a delivery shows up in GitHub’s webhook UI as 200 OK but no PipelineRun appears, the EventListener received it but the interceptor or trigger filter rejected it. Look for interceptor stopped trigger processing in the logs — usually a missing/wrong X-GitHub-Event header (Caddy strips it) or an HMAC mismatch (secret rotation drift between GitHub’s webhook config and the stoa-github-webhook-secret Secret in Frank).
To check the EventListener service is reachable from inside the cluster:
kubectl run el-test --rm -it --image=curlimages/curl --restart=Never -- \
  curl -s -o /dev/null -w "%{http_code}\n" \
  http://el-github-listener.tekton-pipelines.svc.cluster.local:8080
# Expect: 200 (no body posted, but the listener responds 200 on GET)
Manually re-trigger pull-sync
Use cases: GitHub webhook missed delivery (rare — GitHub retries), a transient pull-sync failure that you want to retry without re-pushing the PR, or you’ve just rotated STOA_GITHUB_TOKEN and want to confirm the auth side still works.
# Replay the last delivery from GitHub's webhook UI
# GitHub repo → Settings → Webhooks → click the webhook → Recent Deliveries → Redeliver

# Or fire pull-sync directly with a known SHA (skips the PR/main inference):
kubectl create -n tekton-pipelines -f - <<'EOF'
apiVersion: tekton.dev/v1
kind: PipelineRun
metadata:
  generateName: github-pull-sync-manual-
spec:
  pipelineRef:
    name: github-pull-sync
  params:
    - name: github-repo
      value: agentic-stoa/hum                    # change me
    - name: gitea-repo
      value: agentic-stoa/hum                    # change me
    - name: ref-from
      value: refs/heads/main                     # or refs/pull/<N>/head
    - name: ref-to
      value: refs/heads/main                     # or refs/pull/<N>/head (mirror exact)
    - name: sha
      value: <commit-sha>                        # change me
  workspaces:
    - name: shared-workspace
      volumeClaimTemplate:
        spec:
          accessModes: [ReadWriteOnce]
          storageClassName: longhorn-cicd
          resources:
            requests:
              storage: 1Gi
    - name: ssh-creds
      secret:
        secretName: stoa-bot-ssh-key
        defaultMode: 0400
EOF
After it completes, verify Gitea picked up the SHA:
GITEA_HEAD=$(curl -sf "http://192.168.55.209:3000/api/v1/repos/agentic-stoa/hum/branches/main" \
  -H "Authorization: token $STOA_GITEA_TOKEN" | jq -r .commit.id)
echo "Gitea main: $GITEA_HEAD"
Inspect Caddy logs on Hop when GitHub webhook delivery fails
If GitHub’s UI shows a non-2xx (typically 502 from Caddy or a TLS failure), the issue is upstream of Frank. Three layers to check, in order:
# 1. Caddy access log on Hop — was the request even received?
source .env_hop
kubectl logs -n caddy-system deploy/caddy --tail=50 \
  | grep -E "webhooks.hop.derio.net|192.168.55.223"

# 2. From the Caddy pod, is the upstream reachable over the mesh?
kubectl exec -n caddy-system deploy/caddy -- nc -vz 192.168.55.223 8080
# Expect: succeeded
# Failure usually means Tailscale `--accept-routes` regressed — check tailscale-client DaemonSet:
kubectl logs -n headscale-system ds/tailscale-client --tail=20 | grep -i route

# 3. Is the LB IP actually allocated on Frank?
source .env
kubectl get svc -n tekton-pipelines el-github-listener-lb \
  -o jsonpath='{.status.loadBalancer.ingress[0].ip}{"\n"}'
# Expect: 192.168.55.223
If Caddy logs show the request as 502 Bad Gateway, layer (2) is the failure — Hop can’t reach Frank’s LB IP through the mesh. The fix is on Hop (Tailscale flags), not Frank.
Inspect dual-status posts after a CI run
Both posts are visible by API. After <repo>-ci completes for a SHA:
SHA=<commit-sha>
REPO=agentic-stoa/hum

# GitHub side (mandatory post)
gh api repos/$REPO/commits/$SHA/statuses --jq '.[] | select(.context=="tekton/ci") | {state, target_url, updated_at}'

# Gitea side (best-effort post)
curl -sf "http://192.168.55.209:3000/api/v1/repos/$REPO/statuses/$SHA" \
  -H "Authorization: token $STOA_GITEA_TOKEN" \
  | jq '.[] | select(.context=="tekton/ci") | {state, target_url, updated_at}'
If the GitHub side is missing entirely after a CI run, the github-status Task failed and the PipelineRun should be marked failed too (this is the design — github-status is mandatory). If the Gitea side is missing while GitHub is present, the gitea-status Task hit onError: continue (best-effort) — check kubectl logs -n tekton-pipelines <pod> -c step-post-status. The most common cause is tekton-bot no longer being a member of the agentic-stoa Gitea org (re-add via Gitea UI → Organization Members).
Common GitHub-primary issues
| Symptom | Cause | Fix |
|---|---|---|
| GitHub webhook UI shows 200 but no PipelineRun | EventListener accepted but interceptor/trigger filter rejected | Check kubectl logs -l eventlistener=github-listener for “interceptor stopped” or HMAC mismatch lines |
| GitHub webhook UI shows 502 Bad Gateway | Hop’s Caddy can’t reach 192.168.55.223 over mesh | Verify --accept-routes on Hop’s tailscale-client DaemonSet |
| Hop’s Caddy returns 401 | Caddy validates X-Hub-Signature-256 with a stale secret | Rotate STOA_GITHUB_WEBHOOK_SECRET in Infisical to match GitHub’s webhook config |
github-pull-sync fails on git fetch | STOA_GITHUB_TOKEN PAT expired or missing repo scope | Regenerate PAT with repo (gives both fetch read and statuses:write) |
github-pull-sync fails on git push to Gitea | stoa-bot SSH key rotated; Gitea side has stale fingerprint | Re-add public key in Gitea → stoa-bot → Settings → SSH Keys |
| github-status Task posts but PR shows no check | PAT missing Commit statuses: Read and write (fine-grained PAT) | Add the scope; the x-accepted-github-permissions: statuses=write header in the 403 response is the smoking gun |
| gitea-status posts 404 | tekton-bot isn’t a member of agentic-stoa org | Add membership via Gitea UI → Organization Members |